

The most valuable water on the Moon may be the water that no camera can see.
Orbital instruments have found hydrogen, surface frost and other evidence around the lunar poles. An impact mission has excavated water from a permanently shadowed crater. Yet the three-dimensional shape of the deposits remains uncertain, especially when ice lies below dry soil or extends deeper than a rover can realistically drill.
A team from Lawrence Berkeley National Laboratory, the University of Maryland and the University of Hawaii has now developed a way to ask the buried ground itself. The proposed tool is seismology: measure how vibrations from moonquakes, impacts or controlled sources move between instruments, then use their speed, echoes and scattering to infer where ice-rich regolith begins and ends.
The open-access study, published in Science Advances, does not report a lunar discovery. Its evidence comes from laboratory material, synchrotron x-ray images, thermal calculations, rock-physics models and a three-dimensional computer experiment. Together, they predict a distinctive result. Waves crossing ice-rich soil should travel two to three times faster than waves in nearby dry regolith, while some frozen structures should behave almost like underground mirrors.
Why finding water is not the same as mapping a deposit
The case for lunar polar water is no longer built on a single instrument. Neutron measurements have revealed hydrogen enrichment. Radar, infrared and ultraviolet observations have supplied other clues. In 2009, NASA deliberately sent a Centaur rocket stage into Cabeus crater and flew the LCROSS spacecraft through the resulting plume. The LCROSS mission detected water and other volatiles in material thrown out of permanent shadow.
These findings answer an important question: water exists on the Moon. They do not produce a mining-grade map.
A remotely detected signal may come from a shallow veneer, scattered grains or a more concentrated body hidden below dry material. A permanently shadowed crater can contain temperature gradients, impact debris and rock units with very different physical properties. Resource planners need depth, thickness, concentration and lateral extent, not simply a coloured pixel labelled “hydrogen.”
Drilling provides direct evidence, but every extra metre requires mass, power, thermal control and hardware able to remove cuttings in low gravity and vacuum. A seismic survey cannot replace a sample. It could narrow an enormous search area to the places where sampling is most informative.
How the team made frozen Moon soil on Earth
The researchers began with JSC-1A, a crushed volcanic material used as a lunar-regolith simulant. It is not Apollo soil and it cannot reproduce every feature produced by billions of years of impacts and exposure to space. It provides a controlled granular material whose response can be measured.
In one ultrasonic experiment, a cylindrical sample was saturated with distilled water, cooled to minus 10 degrees Celsius and then measured as it slowly warmed. A parallel nominally dry sample was cooled to minus 40 degrees. The dry material was not baked to remove every trace of adsorbed terrestrial moisture, another reason the experiment should be understood as an analogue rather than a miniature Moon.
The team also froze a sample containing four percent water by weight and scanned it with synchrotron x-ray microtomography at Berkeley Lab’s Advanced Light Source. The images showed why a simple “ice percentage” is not enough. Ice occupied some grain boundaries and some open pores, while other pockets remained dry. Local ice fractions reached much higher values than the average.
That geometry controls stiffness. Ice that cements neighbouring grains together can alter elastic behaviour much more strongly than the same mass divided into loose, isolated particles. The researchers used the observed texture to choose an effective-medium model linking ice fraction to density, bulk modulus, shear modulus and ultimately seismic velocity.
Faster waves are only the first part of the signature
Dry lunar regolith is loose and porous near the surface, so its seismic velocities are low. Filling and cementing part of that pore space with ice makes the material stiffer. A vibration then crosses it more quickly.
In every simulated ice-rich region, wave speed exceeded 1,000 metres per second. That was roughly two to three times the surrounding dry-regolith models. The most ice-rich realisation produced velocities around 3,500 to 4,000 metres per second, while the sparsest distributed-ice case was closer to 1,000 metres per second.
Arrival time is therefore one clue. If two stations inside a permanently shadowed region record systematically faster propagation than a comparable path outside it, the contrast may indicate ice. Within the assumptions of the model, a larger speed change would imply more ice.
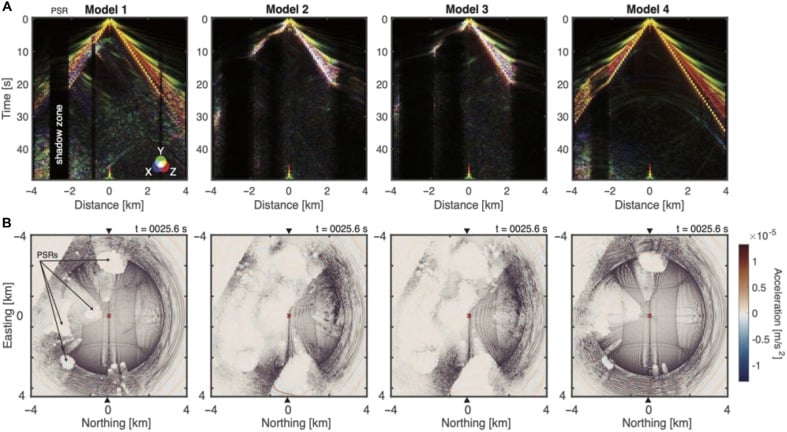
Geometry adds other clues. In models with contiguous frozen floors, the boundary between dry and ice-rich material had reflection coefficients greater than 0.9 for both compressional and shear waves. More than 90 percent of the incident seismic amplitude was reflected backward. Sensors beyond or inside the frozen area received only 10 to 20 percent of the amplitude measured in ice-free zones.
Patchier ice behaved differently. It scattered energy, scrambled wave polarization and prolonged the coda after the first arrival. In two model families, broad shadow zones affected about 75 percent of the simulated profile. Speed, reflection, attenuation and scattering together could help distinguish a continuous frozen layer from a diffuse halo.
The virtual moonquake was small and the array was dense
To see whether those material differences would remain visible in something resembling a lunar survey, the researchers built an 8-by-8-kilometre numerical landscape extending one kilometre below the surface. The grid spacing was four metres.
They placed a magnitude minus 4.5 moonquake ten metres down at the centre and allowed its waves to propagate for 50 seconds. A line of virtual three-component seismometers crossed the model at intervals of 100 metres. The event was deliberately tiny, but its known location, depth and mechanism gave the experiment a clean source.
The resulting wavefields were not subtle. Frozen regions bent, reflected and scattered the pulses into patterns that an array could measure. But a numerical array is easier than a lunar one. Real moonquakes do not occur on command, natural impacts arrive from uncertain places and dozens of closely spaced stations would require deployment, timing, power and communications.
The authors also omitted realistic topography and the full multiscale scattering caused by impact fractures, boulders and heterogeneous regolith. Apollo recordings are famous for long, complicated codas. The team argues that first-arrival times and major ice shadow zones should survive that complexity, but the claim awaits field testing.
What “about 800 metres” means in this work
The approximate 800-metre reach reported for the current method is a model capability, not a measured lunar detection. The paper’s calculations actually contain two relevant vertical limits.
The first-order thermal model extends to 500 metres below the surface. It estimates how cold regions around Mons Mouton could remain with depth and supplies plausible shapes for ancient stable ice. The seismic simulation itself extends 1,000 metres down. Describing the present useful reach as about 800 metres places it within that computational volume, but no seismometer has yet traced a real polar deposit to that depth.
Nor is depth resolution fixed forever at one number. It depends on source frequency, signal strength, station spacing, background noise and the velocity structure of the ground. Lower-frequency waves penetrate farther but usually resolve less detail. A dense active survey can answer a different question from a lone instrument waiting for natural events.
The distinction matters. The method is indirect. High velocity can be produced by stiff ice-cemented soil, but velocity also changes with porosity, compaction, pressure, mineralogy and solid rock layers. A credible lunar interpretation would compare illuminated and permanently shadowed ground, use multiple events and wave types, and combine seismic results with radar, temperature and compositional measurements.
The Moon is getting seismometers again
Apollo astronauts created the first lunar seismic network, and four stations continued operating until 1977. Their records established deep tidal moonquakes, shallow events, thermal disturbances and meteoroid impacts. The archive is still yielding discoveries.
Space Daily previously examined boulders shaken loose beside the Lee-Lincoln fault at Taurus-Littrow, evidence that shallow tectonic activity can reshape a site long after Apollo 17 left. Natural shaking of that kind could illuminate the subsurface for passive instruments, although a useful ice map would need events with favourable paths and sufficiently constrained locations.
New hardware could restore the observational base. NASA’s Farside Seismic Suite is scheduled for a 2027 launch to Schrödinger basin, carrying a very broadband instrument and a short-period sensor. Its central goals concern far-side activity and lunar interior structure, rather than a dedicated ice survey, but it will help establish what the Moon’s seismic background looks like beyond the Apollo near-side network.
The new paper and its University of Maryland announcement also pointed to Chang’e‑7, which carries a seismometer and was expected near the south pole. That timing changed after the study appeared. As Space Daily reported in its closer look at Chang’e‑7’s ice-searching hopper, Chinese authorities said on 23 August that the mission had not met launch conditions and could not fly in its planned 2026 window. They announced no replacement date.
A map before the drill, not proof without one
If the predicted signature appears on the Moon, it could change how polar prospecting is organised. A surface array could first identify paths where waves arrive unusually early. Reflections could mark sharp frozen boundaries. Attenuation and scattered codas could reveal patchier material. Researchers could then position radar profiles, rovers and drills over the most informative targets.
Even a successful seismic map would not show that the detected material is pure water ice, easy to excavate or economically useful. It would not identify contaminants, grain size or the energy needed for extraction. Chemical instruments and physical samples would still be required.
The value of the method is leverage. A small number of carefully placed instruments can listen through volumes of ground that no near-term drill could sample continuously. The new work supplies a quantitative set of features to listen for: waves moving at least twice as fast, strong reflections from contiguous ice, weaker amplitudes in shadow zones and prolonged scattering where ice is diffuse.
For now, all of those features remain predictions calibrated on terrestrial simulant and tested in a simplified virtual Moon. That is a real limitation, but also a testable one. The next generation of lunar seismometers will not need to accept the model on faith. They can wait for the Moon to shake and see whether hidden ice answers differently from dry ground.