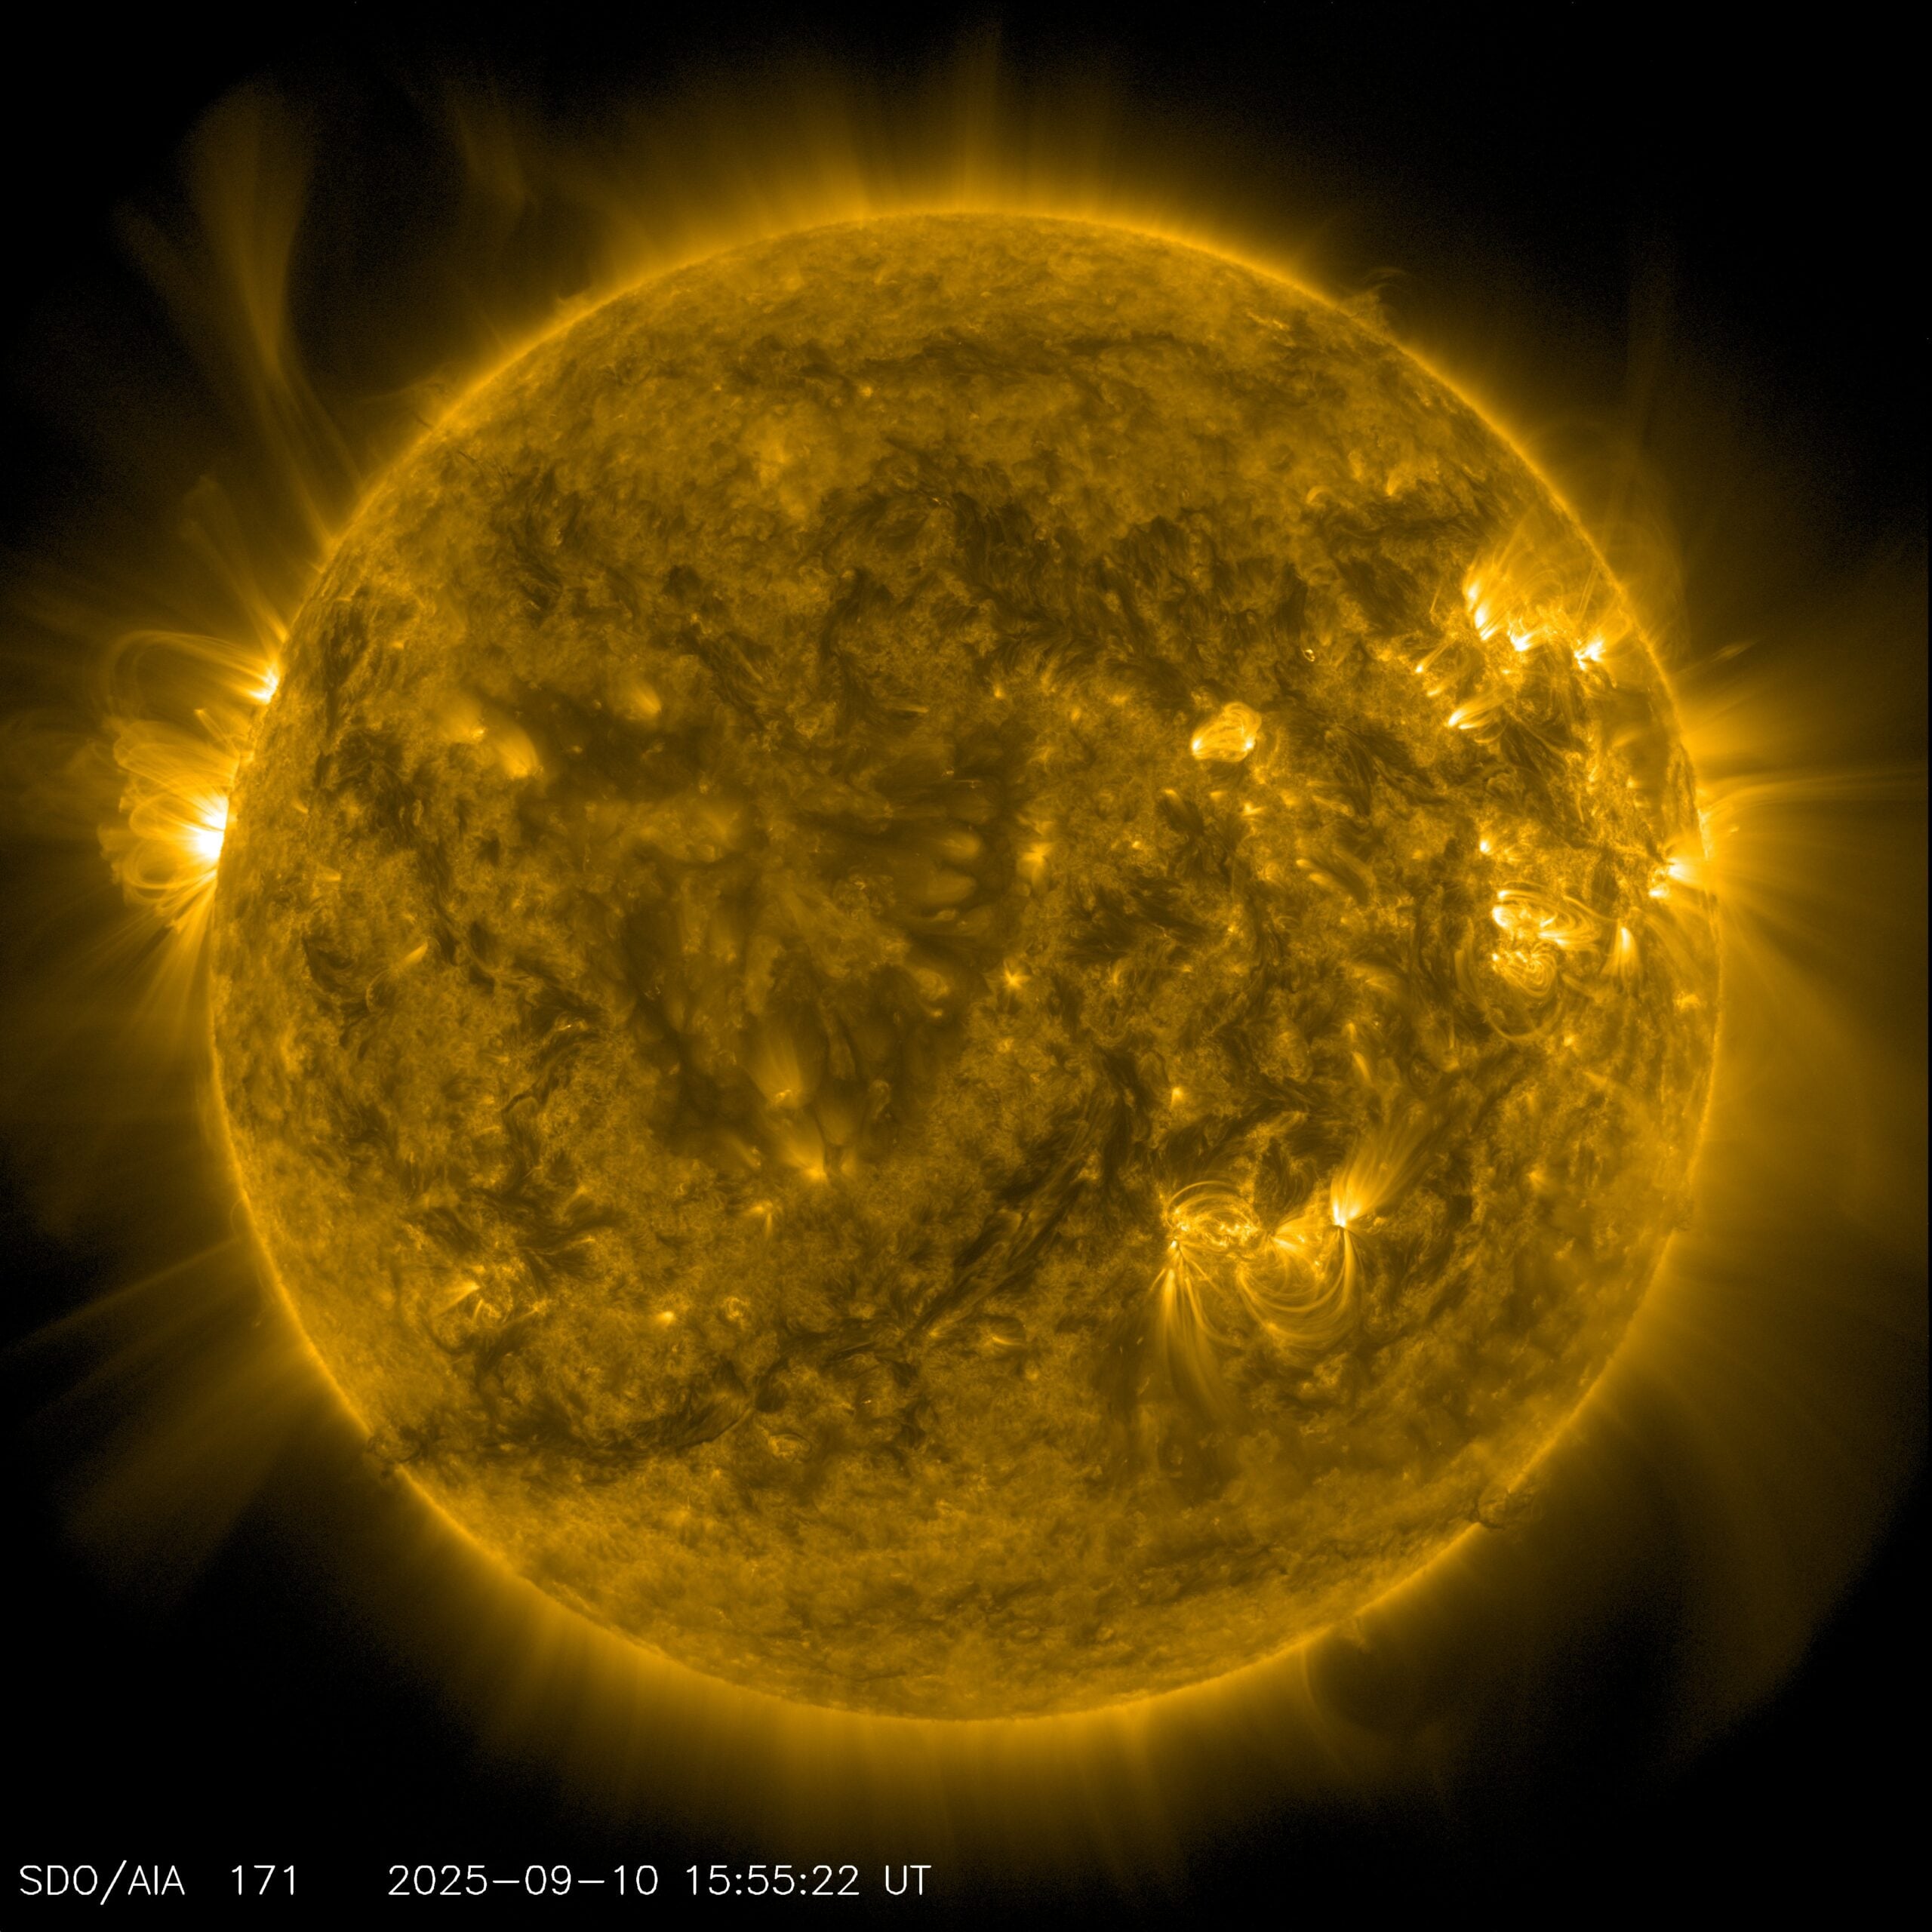
The Sun reached an exceptionally deep minimum in 2008 after roughly two decades of declining activity. Sunspot counts were low, the solar wind was weak and solar cycle 24 would become the quietest of the space age. Some researchers wondered whether the minimum might mark the entrance to a lull lasting several decades.
That trajectory reversed. Jamie Jasinski of NASA’s Jet Propulsion Laboratory and Marco Velli of JPL and UCLA analysed solar-wind measurements from 2008 to 2025 and found a steady rise across plasma and magnetic-field parameters. Their paper, “The Sun Reversed Its Decades-long Weakening Trend in 2008,” was published in The Astrophysical Journal Letters on 8 September 2025.
SpaceDaily reported the broad finding in July. What is worth slowing down for is the measurement underneath it. “Activity” here is not simply a sunspot count, and “strengthening” does not mean every year must produce more flares than the one before.
This is one study, not a forecast of an uninterrupted climb. It identifies a long-term change that sits beneath the familiar rise and fall of the approximately 11-year solar cycle.
Why the 2008 minimum raised a larger question
The Sun naturally moves between solar maximum and solar minimum. The decline leading into 2008 looked more consequential because it had persisted since the mid-1980s, spanning more than one ordinary cycle. Earlier work had measured steep falls in solar-wind mass, momentum and energy flux.
History supplied uncomfortable precedents. Sunspot observations record the Maunder Minimum from roughly 1645 to 1715 and the Dalton Minimum from about 1790 to 1830. Nobody knew in 2008 that the Sun was beginning another one. The point was that a multi-cycle decline made that possibility scientifically plausible enough to examine.
As Jasinski put it in NASA’s September 2025 account, the available signs had appeared to point towards a prolonged low-activity phase. The surprise was not that activity rose after a minimum. It was that the longer weakening trend itself changed direction.
What the spacecraft record actually measured
Jasinski and Velli used NASA’s OMNIWeb Plus dataset, which brings together measurements from several spacecraft near Earth’s orbital distance. Two central sources were NASA’s ACE and Wind missions, both launched in the 1990s and capable of supplying long, overlapping records.
The authors averaged the measurements over complete solar rotations to reduce short-lived variation and fitted the trend from 2008 to 2025. Across that interval, solar-wind speed increased by about 6 per cent. Proton density rose by 26 per cent and proton temperature by 29 per cent.
Those changes combine. Thermal pressure increased by about 45 per cent, mass flux by 27 per cent, dynamic pressure by 34 per cent and energy flux by 40 per cent. The magnitude of the interplanetary magnetic field carried by the wind rose by roughly 31 per cent, while its radial component increased by 33 per cent.
I find the contrast between speed and pressure especially useful. The wind did not simply start racing dramatically faster. A modest speed increase, accompanied by substantially denser and hotter plasma, produced a much larger shift in the force and energy the wind carries.
Why this is not just another name for solar cycle 25
A sunspot graph rises and falls strongly over each approximately 11-year cycle. If the 2008 minimum is compared carelessly with the active Sun of 2024 or 2025, an upward line is almost guaranteed.
The paper’s case does not rest on that simple endpoint comparison. It examines solar-rotation averages, fitted trends in multiple wind parameters and corresponding phases of solar cycles 24 and 25. The different measures move together in a way consistent with the Sun recovering from the longer decline that preceded 2008.
There is still no neat explanation for why that multi-decade decline began or why it stopped. The solar dynamo produces the familiar cycle through changing magnetic fields inside the Sun, but variations stretching across several cycles remain harder to predict. The data establish the reversal more securely than they establish its cause.
The recovery is real, but it is not a new record
The paper’s fitted average solar-wind dynamic pressure for the current cycle is about 1.9 nanopascals. Near the end of the 20th century, the recorded level was around 2.4 nanopascals. The Sun has climbed out of an unusually weak state without yet returning to that earlier strength.
This matters for the heliosphere, the bubble inflated by the solar wind around the Solar System. More dynamic pressure should push its outer boundaries farther away. Closer to home, changes in the wind and its embedded magnetic field alter the pressure applied to planetary magnetospheres.
NASA noted that a generally more active Sun could bring more space-weather events, including flares and coronal mass ejections. That statement needs a boundary. A 17-year background trend cannot predict the date, direction or severity of any individual solar storm. It is context for space-weather risk, not a storm warning.
The next solar cycle remains the real test
The authors leave the future open. Continued measurements will show whether the increase persists into later cycles or whether the wind settles near its present level. Seventeen years is long by spacecraft-mission standards, but it is not long compared with all possible multi-cycle solar variations.
The cautious conclusion is that the deep minimum of 2008 now looks more like the bottom of a roughly 20-year weakening phase than the beginning of a modern Maunder- or Dalton-like minimum. Solar cycle 24 was probably an unusually weak outlier rather than the first step into decades of quiet.
What changed after 2008 was not only the Sun’s activity. The story scientists could responsibly tell about its direction changed with it.