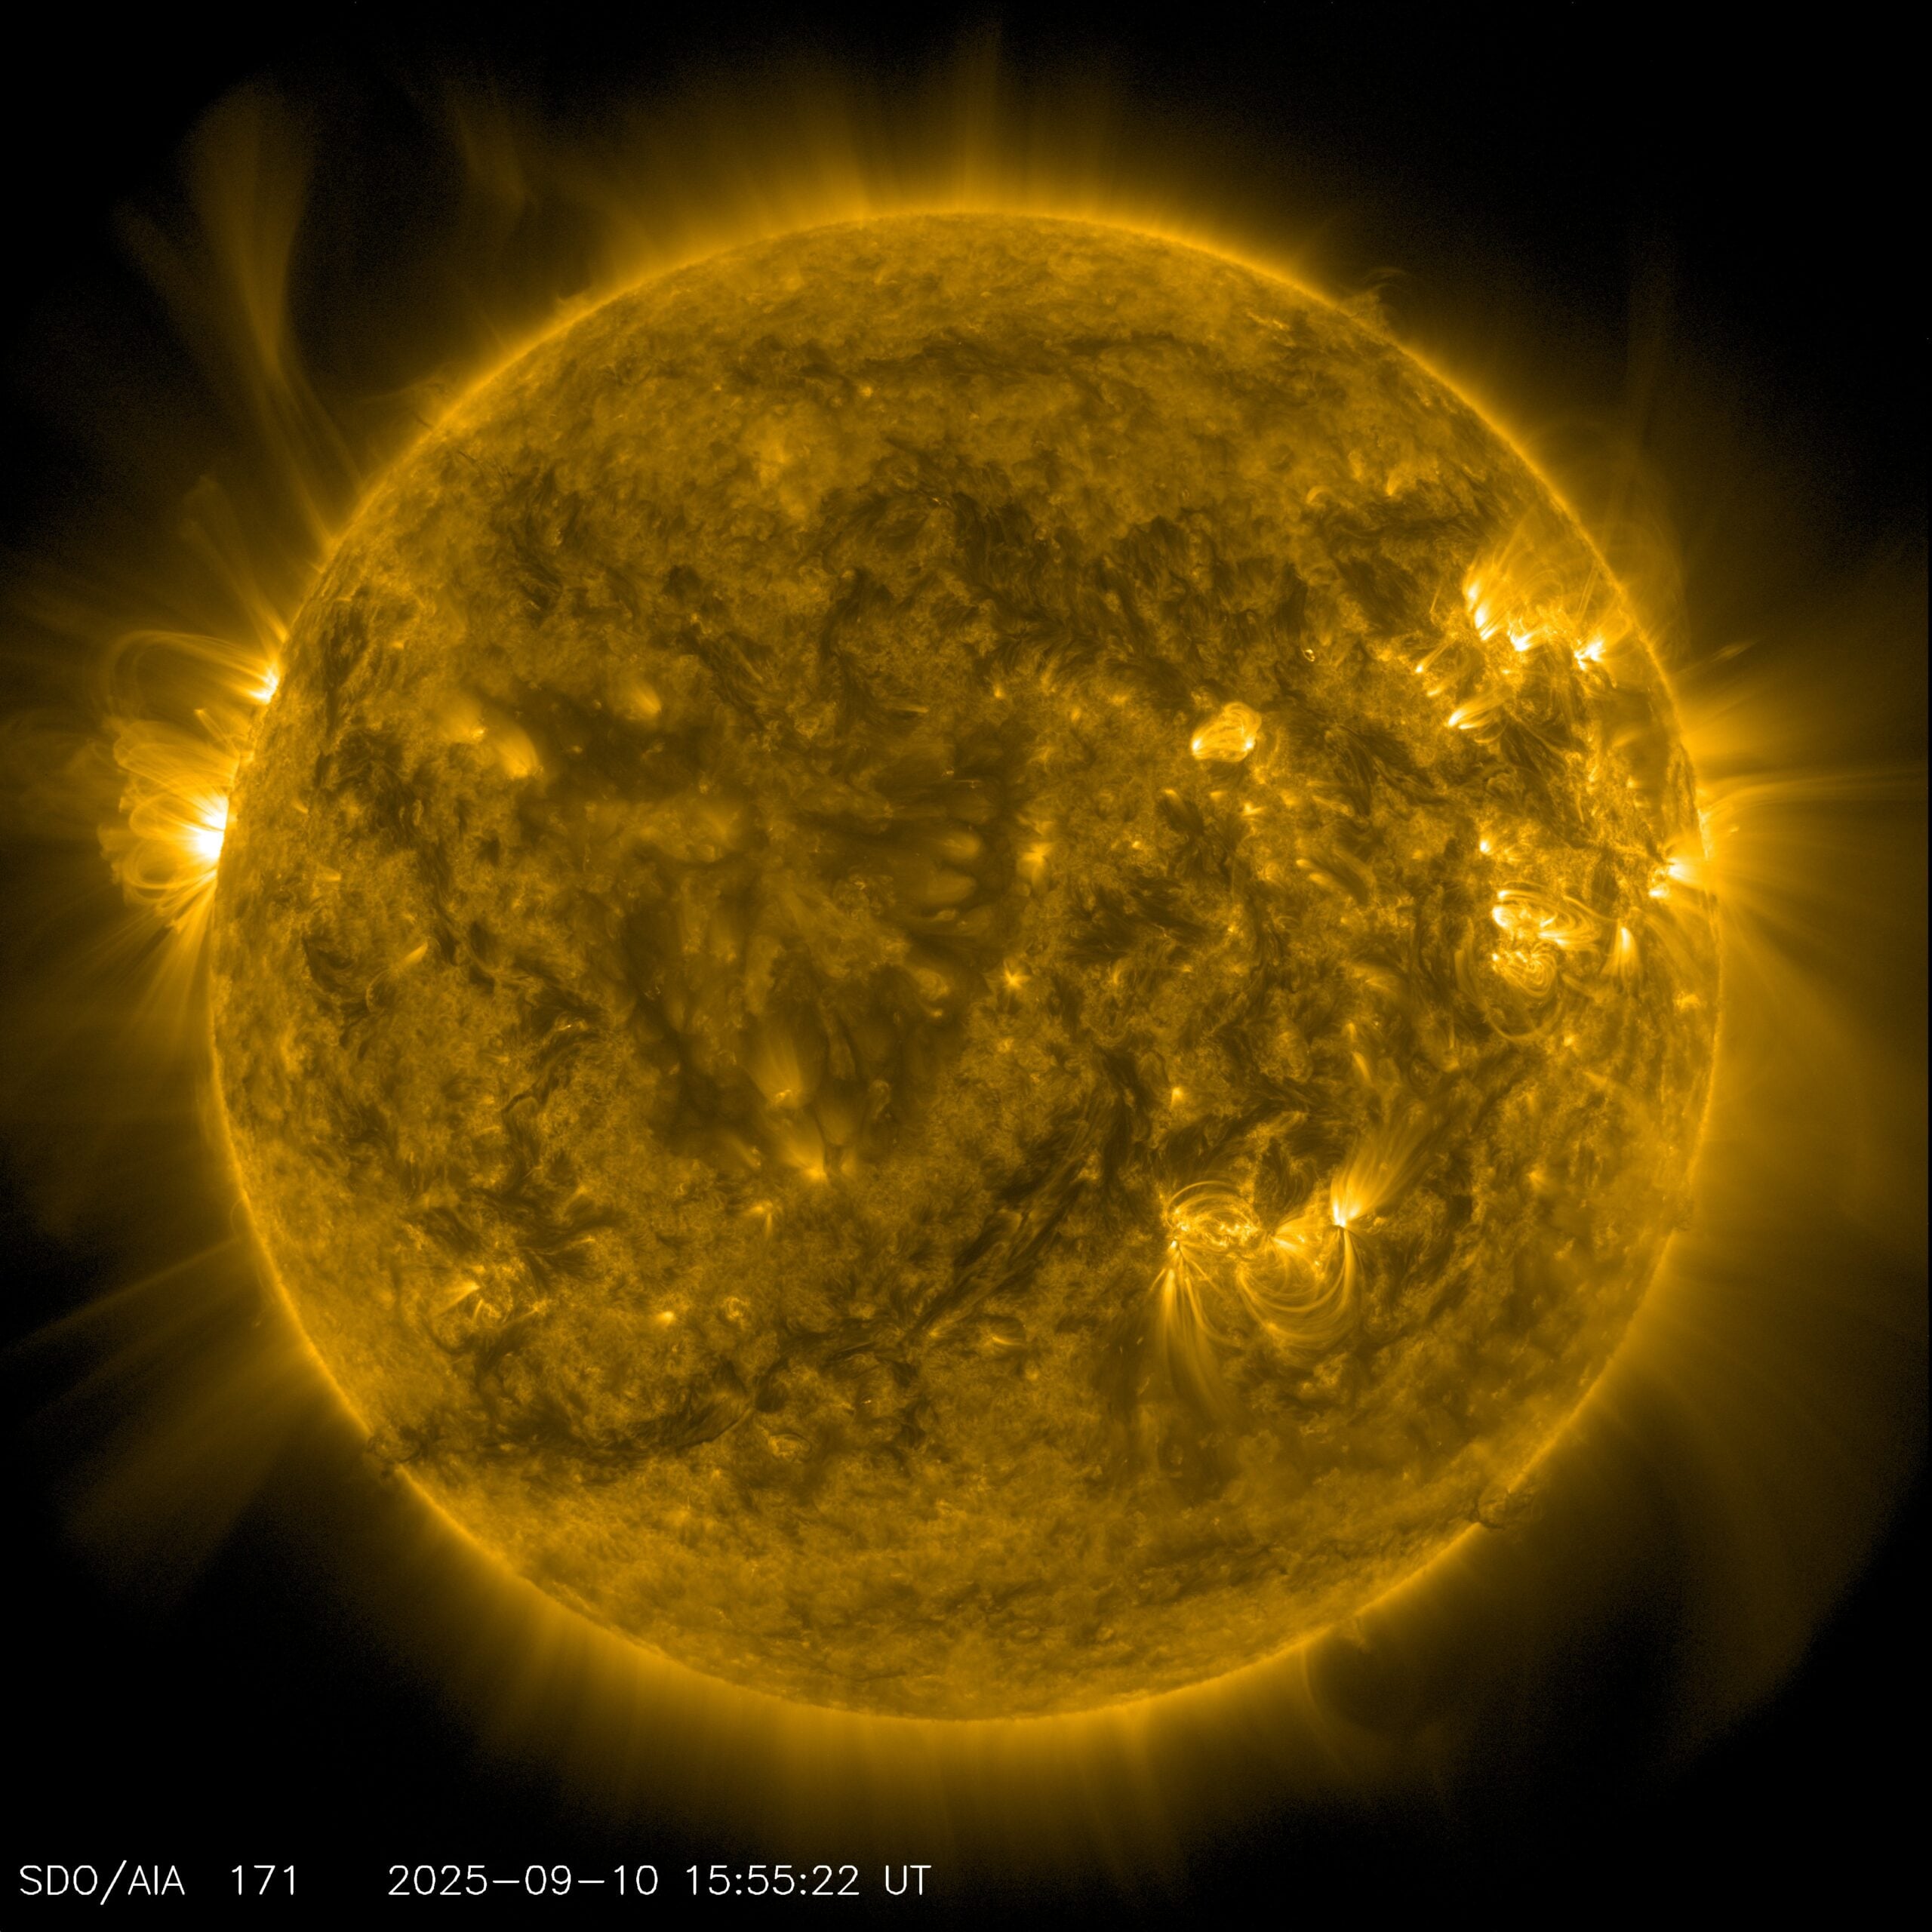
In 2008, the Sun seemed to be fading into an unusually deep silence.
Sunspots had become scarce. The solar wind, the stream of charged particles flowing away from the Sun, had weakened over roughly two decades. Several of its basic properties had fallen to levels not seen during the spacecraft era.
For solar physicists, the obvious question was whether this was more than an ordinary low point in the Sun’s familiar 11-year cycle. Could it be the beginning of a prolonged quiet phase resembling the grand minima recorded in earlier centuries?
The Sun did not cooperate with that expectation.
In a study published in The Astrophysical Journal Letters in September 2025, Jamie Jasinski and Marco Velli reported that the long decline ended in 2008. Across a range of solar-wind and magnetic measurements, the underlying trend has pointed upward since then.
“The Sun is slowly waking up” was how Jasinski described it in NASA’s account of the study.
That phrase is accurate, but it can be misunderstood. The Sun has not grown steadily more violent every year, and it has not escaped its normal cycle. What changed is the baseline underneath those cycles.
The quiet Sun of 2008 looked like the start of something larger
The number of sunspots rises and falls over a cycle lasting roughly 11 years. Near solar maximum, the Sun’s magnetic field becomes tangled and active regions multiply. Flares and coronal mass ejections become more frequent. Near minimum, the visible disk can go days or weeks with few spots.
This pattern is itself one half of a 22-year magnetic process. The Sun’s north and south magnetic poles reverse around each maximum, then return to their original orientation during the following cycle.
Solar Cycle 23 ended with a minimum that was exceptional even by minimum standards. During 2008 and early 2009 the Sun remained spotless for long stretches, while measurements near Earth’s orbit showed an unusually weak solar wind.
The weakness also fitted a longer pattern. From the 1980s to 2008, several solar-wind parameters had declined across more than one cycle. That raised the possibility that the ordinary oscillation was riding on top of a deeper, multi-decade fall.
History offered two famous precedents. The Maunder Minimum lasted from about 1645 to 1715, while the Dalton Minimum extended from roughly 1790 to 1830. Neither was simply one weak 11-year cycle. Both were extended periods in which solar activity remained subdued.
Not every researcher predicted that 2008 would lead to a new grand minimum. Solar-cycle forecasts are difficult and competing models existed. But the evidence was strong enough that a prolonged weak phase became a serious scientific possibility.
The study looked beyond sunspots
Sunspots are the longest-running record of solar activity, but they are not the only measurement available. Spacecraft can directly sample the plasma and magnetic field flowing past Earth.
Jasinski and Velli analysed the OMNI data set maintained by NASA’s Goddard Space Flight Center. It combines and cross-calibrates observations from multiple spacecraft near Earth’s orbit, including long-running measurements from the Wind and Advanced Composition Explorer missions.
The study examined solar-wind proton speed, density and temperature, as well as thermal pressure, mass flux, dynamic pressure, energy flux and the interplanetary magnetic field carried outward by the wind.
This matters because “solar activity” is not one dial. Wind speed can change while density moves differently. The magnetic field may strengthen by a much larger fraction than velocity. Two solar winds travelling at similar speeds can place very different pressure on a planet’s magnetic shield if one carries more particles.
To reduce the distortion from short-lived streams and eruptions, the researchers averaged the measurements across full solar rotations. They then fitted long-term trends beginning near the 2008 minimum and compared the rising phases of Solar Cycles 24 and 25.
The resulting paper, “The Sun Reversed Its Decades-long Weakening Trend in 2008”, was published on 8 September 2025.
The largest change was not the wind’s speed
Between the fitted values for late 2008 and early 2025, solar-wind speed increased by about 6 percent. That is real, but it was the smallest of the major rises.
Proton density increased by roughly 26 percent and proton temperature by 29 percent. Mass flux rose by 27 percent. Dynamic pressure increased by 34 percent, while energy flux rose by about 40 percent.
Thermal pressure recorded the largest increase at approximately 45 percent. The magnitude of the interplanetary magnetic field rose by around 31 percent, and its radial component by 33 percent.
The pattern therefore describes a wind that is somewhat faster, but much denser, hotter, more forceful and more strongly magnetised than the wind measured at the 2008 low.
A comparison between equivalent rising portions of the two most recent cycles pointed in the same direction. From the ascent of Cycle 24 to the ascent of Cycle 25, dynamic pressure was about 18 percent higher and energy flux about 22 percent higher. The magnetic-field magnitude increased by roughly 15 percent.
The agreement between those comparisons helps show that the result is not merely the inevitable climb from one solar minimum toward the next maximum.
This is a recovery, not an unprecedented escalation
The percentages sound dramatic because they begin at an exceptionally weak baseline.
Solar-wind dynamic pressure rose from a fitted value of about 1.39 nanopascals in 2008 to around 1.86 nanopascals in 2025. Yet the average measured from 1974 to 1994 was about 2.36 nanopascals.
In other words, the Sun has regained part of what it lost during the long decline, but several measurements remain below late-20th-century averages.
This distinction is central to the paper. The authors did not claim that the Sun is entering a new era of unprecedented activity. They concluded that Solar Cycle 24 was probably an unusually weak outlier and that the Sun is recovering from a decline lasting around two decades.
Nor does the fitted line guarantee that activity will keep rising indefinitely. The data set contains only two rising cycles after the 2008 turning point. Future measurements are needed to show whether the trend continues, levels off or reverses again.
The American Astronomical Society later selected the study as one of its notable papers of 2025, summarising the result as a longer-term rise laid over the regular solar cycle.
Cycle 25 supplied a visible sign of the reversal
Solar Cycle 25 began in December 2019. Early forecasts expected it to resemble the weak Cycle 24. Instead, sunspots and eruptions accumulated faster than the original consensus prediction.
In October 2024, NASA and the US National Oceanic and Atmospheric Administration announced that the Sun had entered the maximum period of Cycle 25. NOAA’s announcement stressed that a maximum is a period rather than a single day and that the final peak can only be identified after activity has declined.
The strong cycle was consistent with the new study, but the two observations are not identical. A lively Cycle 25 alone would not prove a multi-decade reversal. The paper’s case rests on many plasma and magnetic measurements rising from 2008 through both Cycle 24 and Cycle 25.
That is why the full-rotation averages matter. They allow researchers to look through the daily noise of flares, fast streams and quiet intervals and ask whether the background state of the solar wind itself has shifted.
A stronger wind changes the space around every planet
The solar wind fills the heliosphere, the enormous bubble dominated by the Sun’s plasma and magnetic field. When the wind’s dynamic pressure rises, the outer boundary of that bubble can be pushed farther into interstellar space.
Closer to the Sun, the same pressure acts on planetary magnetospheres. Earth’s magnetic field deflects most of the flow, but its sunward boundary is compressed when solar-wind pressure increases. The magnetospheres of Jupiter and Saturn may be even more responsive because of their scale and structure.
A stronger interplanetary magnetic field can also alter how efficiently energy enters a planet’s magnetic environment. The details depend on the field’s orientation, not merely its strength. A powerful wind pointing the wrong way for magnetic reconnection may have less effect at Earth than a weaker wind with a favourable orientation.
For that reason, the long-term trend cannot predict the date or severity of an individual geomagnetic storm. It does suggest that the background conditions supporting space weather have become more active.
That matters to satellites, navigation and radio systems, power grids and astronauts travelling beyond Earth’s protective atmosphere. NASA’s broader heliophysics programme watches the Sun continuously because conditions can change on timescales ranging from seconds to decades.
It does not mean the Sun is driving modern climate change
“The Sun is growing more active” can easily be heard as “the Sun is sending Earth much more heat.” The study did not show that.
Its central measurements concern the solar wind and interplanetary magnetic field, not a large increase in the visible light and total radiant energy warming Earth’s surface.
NASA’s climate analysis finds that the solar energy reaching Earth has followed its natural cycle with no net increase since the 1950s. Satellite measurements show that total solar irradiance changes by only around one tenth of one percent over a typical cycle.
According to NASA’s comparison of solar and human climate forcing, the warming influence from greenhouse gases emitted by human activity since 1750 is more than 270 times larger than the slight additional warming attributed to the Sun over the same period.
The 2025 result is important for heliophysics and space weather. It does not overturn the evidence identifying greenhouse gases as the cause of recent global warming.
The reversal exposes the limits of solar prediction
The deepest mystery is why the longer trend changed direction in 2008.
The Sun’s roughly 11-year rhythm is tied to the rearrangement of its magnetic field, but the processes producing multi-decade minima and recoveries remain less predictable. The timing of the reversal near the end of Solar Cycle 23 hints that the full 22-year Hale magnetic cycle, or even longer overlapping magnetic patterns, may be involved.
That is a clue, not a complete mechanism.
The finding also shows why one exceptionally weak cycle cannot define the next half-century. In 2008, the Sun appeared to be following a decline that had persisted for decades. The measurements were real. The inference that the decline might continue was reasonable.
Then the physical system changed direction.
What scientists can now say is narrower and more interesting than a prediction of endless escalation. The modern Sun reached an extraordinary low, failed to settle there and has spent the years since rebuilding the wind and magnetic field that extend its influence across the solar system.
Whether that recovery continues through the next solar cycle is the part of the story the Sun has not yet revealed.