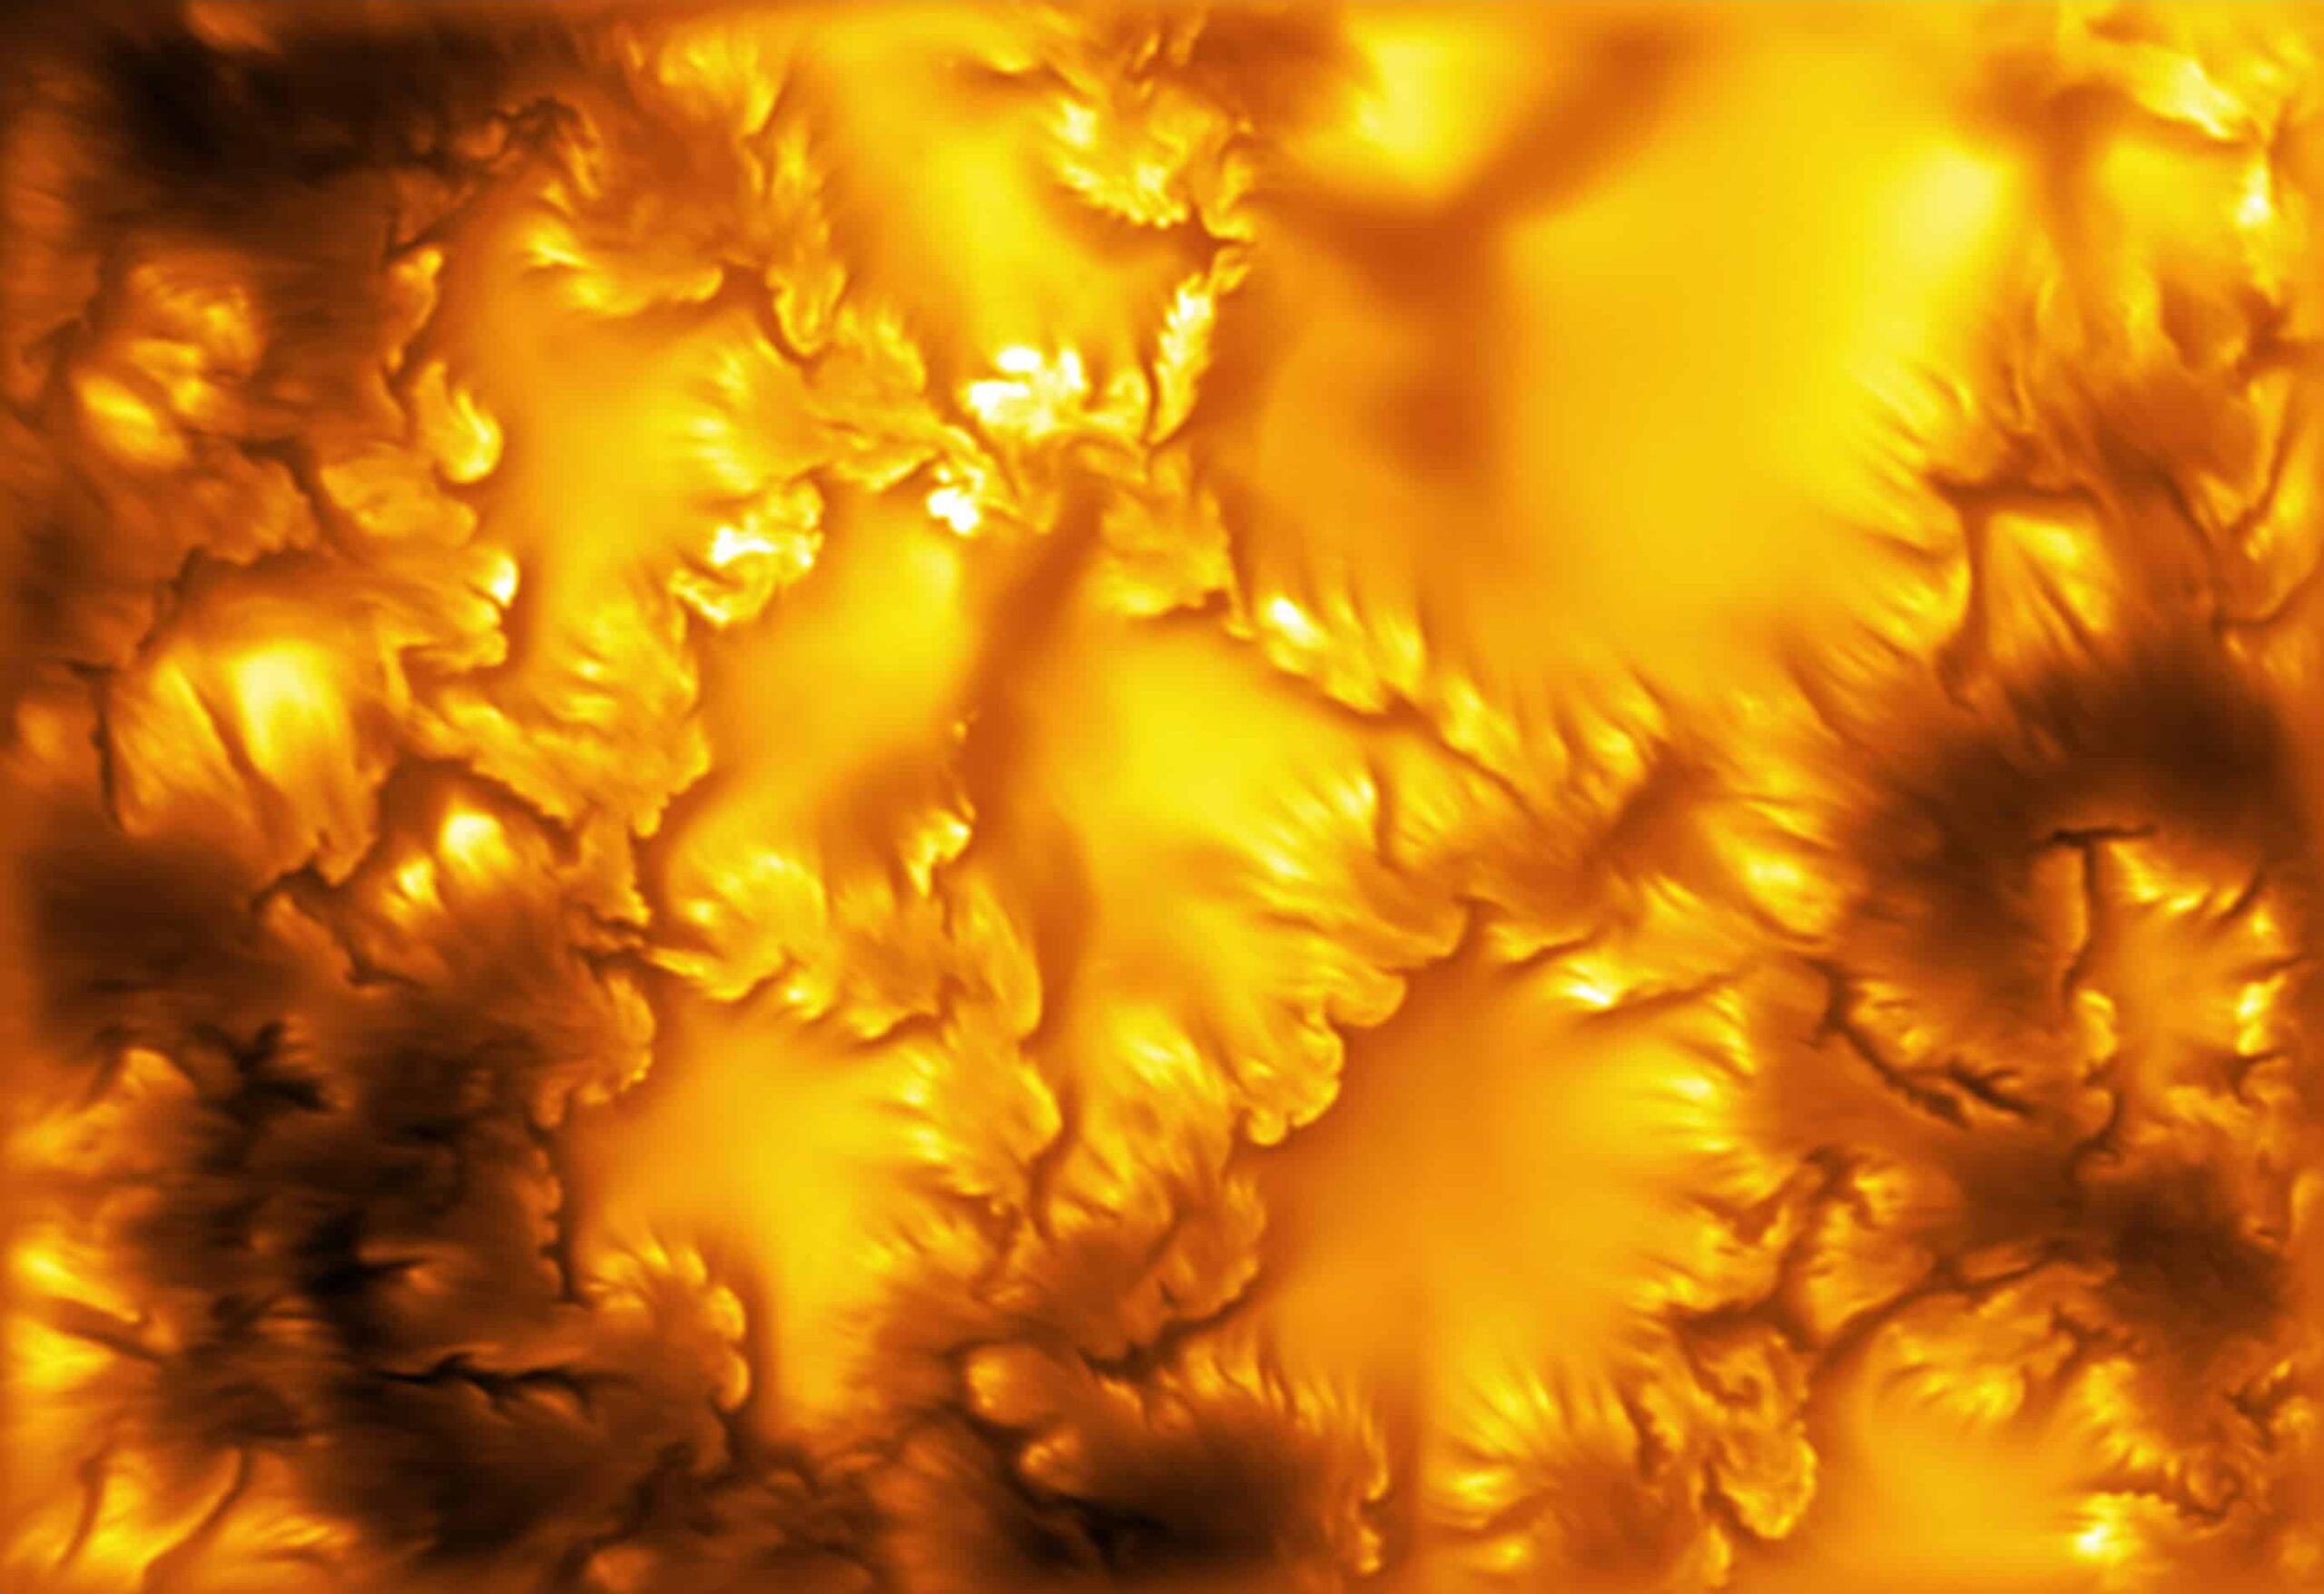
The sharpest view yet made of the Sun’s visible surface does not look like a smoother version of an old solar photograph. It looks like a different physical landscape.
Along the borders of small magnetic structures, the previously blurred edge breaks into dark stripes and curling forms. In time-lapse sequences, some roll like the crest of an ocean wave. The smallest approach the size of a city.
An international team says those forms are the first unambiguous detection of Kelvin-Helmholtz instability in the solar photosphere. The phenomenon is well known in clouds, oceans, planetary atmospheres and space plasmas. On the Sun’s visible surface, theory had run ahead of eyesight.
The Nature paper published on 5 August 2026 closes that observational gap. It also opens a harder question. If these tiny vortices continually bend magnetic boundaries, how much energy can they send into the atmosphere above?
The record image came from a small patch near a sunspot
The Daniel K. Inouye Solar Telescope observed active region NOAA 14060 on 14 April 2025. The target was a magnetically active area near a sunspot, not the entire solar disc.
A context image from NASA’s Solar Dynamics Observatory located the patch. Inouye’s Visible Broadband Imager then narrowed the view, and a Max Planck FastCam recorded the finest field at 21:39 UTC. The final scene spans only a tiny fraction of the Sun but resolves its surface at approximately 19 kilometres.
The camera observed blue-continuum light at a wavelength of 416 nanometres. The gold and orange palette in the public image is a display choice, as NASA’s Astronomy Picture of the Day explains. It is not the naked-eye colour of that narrow wavelength channel.
Calling it the sharpest-ever image refers to spatial resolution at the visible surface. It is not a new full-disc portrait, and it should not be confused with record images of the much fainter corona made using other instruments and wavelengths.
There are three different small-scale numbers
The headline’s 20-kilometre figure needs a little unpacking. The telescope’s resolution was close to 19 kilometres at 416 nanometres, and the smallest detected vortices approached that theoretical diffraction limit. The Max Planck team also describes fringes a little more than 20 kilometres wide.
When the researchers analysed 47 observed vortices, their reported sizes ranged from about 25 to 170 kilometres. The characteristic spatial wavelength, meaning the typical distance from one vortex to the next along an unstable interface, was about 65 kilometres.
Resolution, vortex size and vortex spacing are not interchangeable. Twenty kilometres is the frontier of detail that made the discovery possible, not the diameter assigned to every whirlpool in the field.
That scale is still extraordinary. The Max Planck Institute compares it to recognising a one-euro coin from 180 kilometres away. Inouye had to do the solar equivalent through Earth’s atmosphere while keeping a four-metre telescope trained on an intensely bright, turbulent star.
The surface is already moving before magnetism intervenes
The photosphere is the thin atmospheric layer from which most visible sunlight escapes. It is often called the surface because the Sun has no solid ground beneath it.
Convection covers this layer in granules roughly 500 to 2,000 kilometres across. Hot plasma rises in bright centres, radiates energy, cools and sinks along darker lanes. The pattern can resemble boiling liquid, although the material is ionised gas moving under gravity, radiation and magnetic forces.
Magnetism rearranges that convective scene. Concentrated fields can inhibit the ordinary transport of heat, helping produce dark pores and sunspots. Around smaller magnetic concentrations, granulation brings streams of plasma into contact with boundaries moving at different speeds.
Lower-resolution images made those interfaces look comparatively smooth. Inouye revealed that they were composed almost throughout of fine striations and vortex-like structures. The missing physics had been living below the blur.
Kelvin-Helmholtz instability begins with unequal speeds
Kelvin-Helmholtz instability forms at a shear layer, the interface where adjacent fluids move past one another at different velocities. A slight disturbance can grow rather than flatten. The boundary develops waves, the waves curl over and a procession of vortices appears.
The same geometry can form in wind-shaped clouds and on the surface of water. It has also been observed in the atmospheres of Jupiter and Saturn and where the solar wind meets planetary magnetospheres.
On the Sun, the medium is a magnetised plasma. Charged particles and magnetic fields influence one another, so the rolling motion does more than mix two ordinary fluids. It can deform magnetic concentrations and redistribute magnetic flux.
The team measured apparent vortex propagation speeds from about 0.67 to 3 kilometres per second. Growth rates derived by tracking deformations along unstable boundaries showed that the forms evolved rapidly enough to be followed through the high-cadence image sequence.
A photograph alone did not identify the instability
Wave-like curls are suggestive, but resemblance is not a physical diagnosis. The researchers therefore compared Inouye’s observations with radiation-magnetohydrodynamic simulations produced with the MURaM code.
The calculation represented a magnetically active photospheric region on a grid spaced at 3.2 kilometres. From it, the team generated synthetic intensity images that could be compared with the telescope data. The simulations produced similarly shaped vortices and striations at the boundaries between magnetic and less-magnetic plasma.
The characteristic spacing agreed too: roughly 65 kilometres in the observations and about 50 kilometres in the simulations. Within the model, researchers could inspect quantities a broadband image does not directly supply, including the velocity field and vertical magnetic flux. Those data showed the vortex motions bending magnetic boundaries.
The convergence of time-resolved observation, analytical expectations and a physics-based simulation is what supported the Kelvin-Helmholtz identification. The National Solar Observatory’s release describes dozens of examples in both the real and synthetic scenes, rather than one unusually photogenic curl.
Small vortices could keep magnetic fields under stress
Solar flares, jets and coronal mass ejections release energy stored in the Sun’s magnetic field. One important family of explanations begins with footpoint motions near the photosphere. As plasma moves, it can twist, braid and stress field lines extending into the atmosphere.
A stressed magnetic arrangement stores free energy. If oppositely directed field components are driven together, magnetic reconnection can rearrange the field and turn part of that energy into particle acceleration, motion and heat.
The new vortices offer a possible engine for that continual stressing. In the observed region, they appeared repeatedly wherever granulation met sufficiently strong magnetic features. The simulations indicate that they mix magnetised and comparatively weakly magnetised plasma while distorting the interface between them.
That mixing may also help explain how magnetic flux spreads and dissipates through the lower atmosphere. The Sun rebuilds and reverses its global magnetic configuration on an approximately 11-year cycle, so flux cannot simply remain frozen forever into the patterns where it first appears. Existing models have difficulty reproducing all of the required transport.
The coronal-heating link is promising but unmeasured
The visible photosphere is around 5,500 degrees Celsius. Much of the corona reaches roughly 1 to 2 million degrees, with active regions hotter still. As SpaceDaily’s earlier examination of the coronal-heating problem explained, the leading mechanisms include waves and many small episodes of magnetic reconnection. They may work together rather than compete for one exclusive answer.
Kelvin-Helmholtz vortices could contribute to both sides of that picture. Their motion can perturb magnetic fields and may launch or feed waves. By twisting and braiding magnetic structure, they could also help create the stressed conditions from which reconnection releases heat.
But the 2026 paper does not show that these vortices supply the corona’s required energy budget. It establishes the instability at the photosphere and demonstrates efficient small-scale mixing in simulations. It does not follow a measured packet of energy from a 20-kilometre swirl all the way into million-degree coronal plasma.
The next phase is therefore quantitative. Automated searches can count the structures across larger areas and longer intervals. Spectropolarimetric observations can add plasma velocities and magnetic-field information. Researchers can then estimate how much energy the vortices carry upward and how often their twisting produces dissipative events.
Sharper seeing changed the physical question
The Inouye telescope sits near the summit of Haleakala on Maui. Its four-metre primary mirror provides the light-gathering power and diffraction limit needed for extreme solar resolution, while adaptive optics and image reconstruction combat atmospheric distortion.
That engineering matters because the Sun’s large-scale behaviour is built from processes far smaller than a sunspot. Space weather begins with magnetic energy accumulating and being released. The chain can end with a coronal mass ejection disturbing satellites, radio links and power systems near Earth, but its first steps may occur in structures only tens of kilometres wide.
Even Parker Solar Probe, which has sampled the corona directly, sees a different part of the chain. Parker measures plasma and fields far above the photosphere. Inouye watches motions at the lower boundary where some of that energy may be injected.
The record image has therefore done more than reveal solar texture. It has turned a theoretical instability into something researchers can locate, count and measure. Whether those small vortices provide a minor contribution or a substantial piece of coronal heating remains open. For the first time, the relevant swirls are no longer hidden below the telescope’s resolution.