
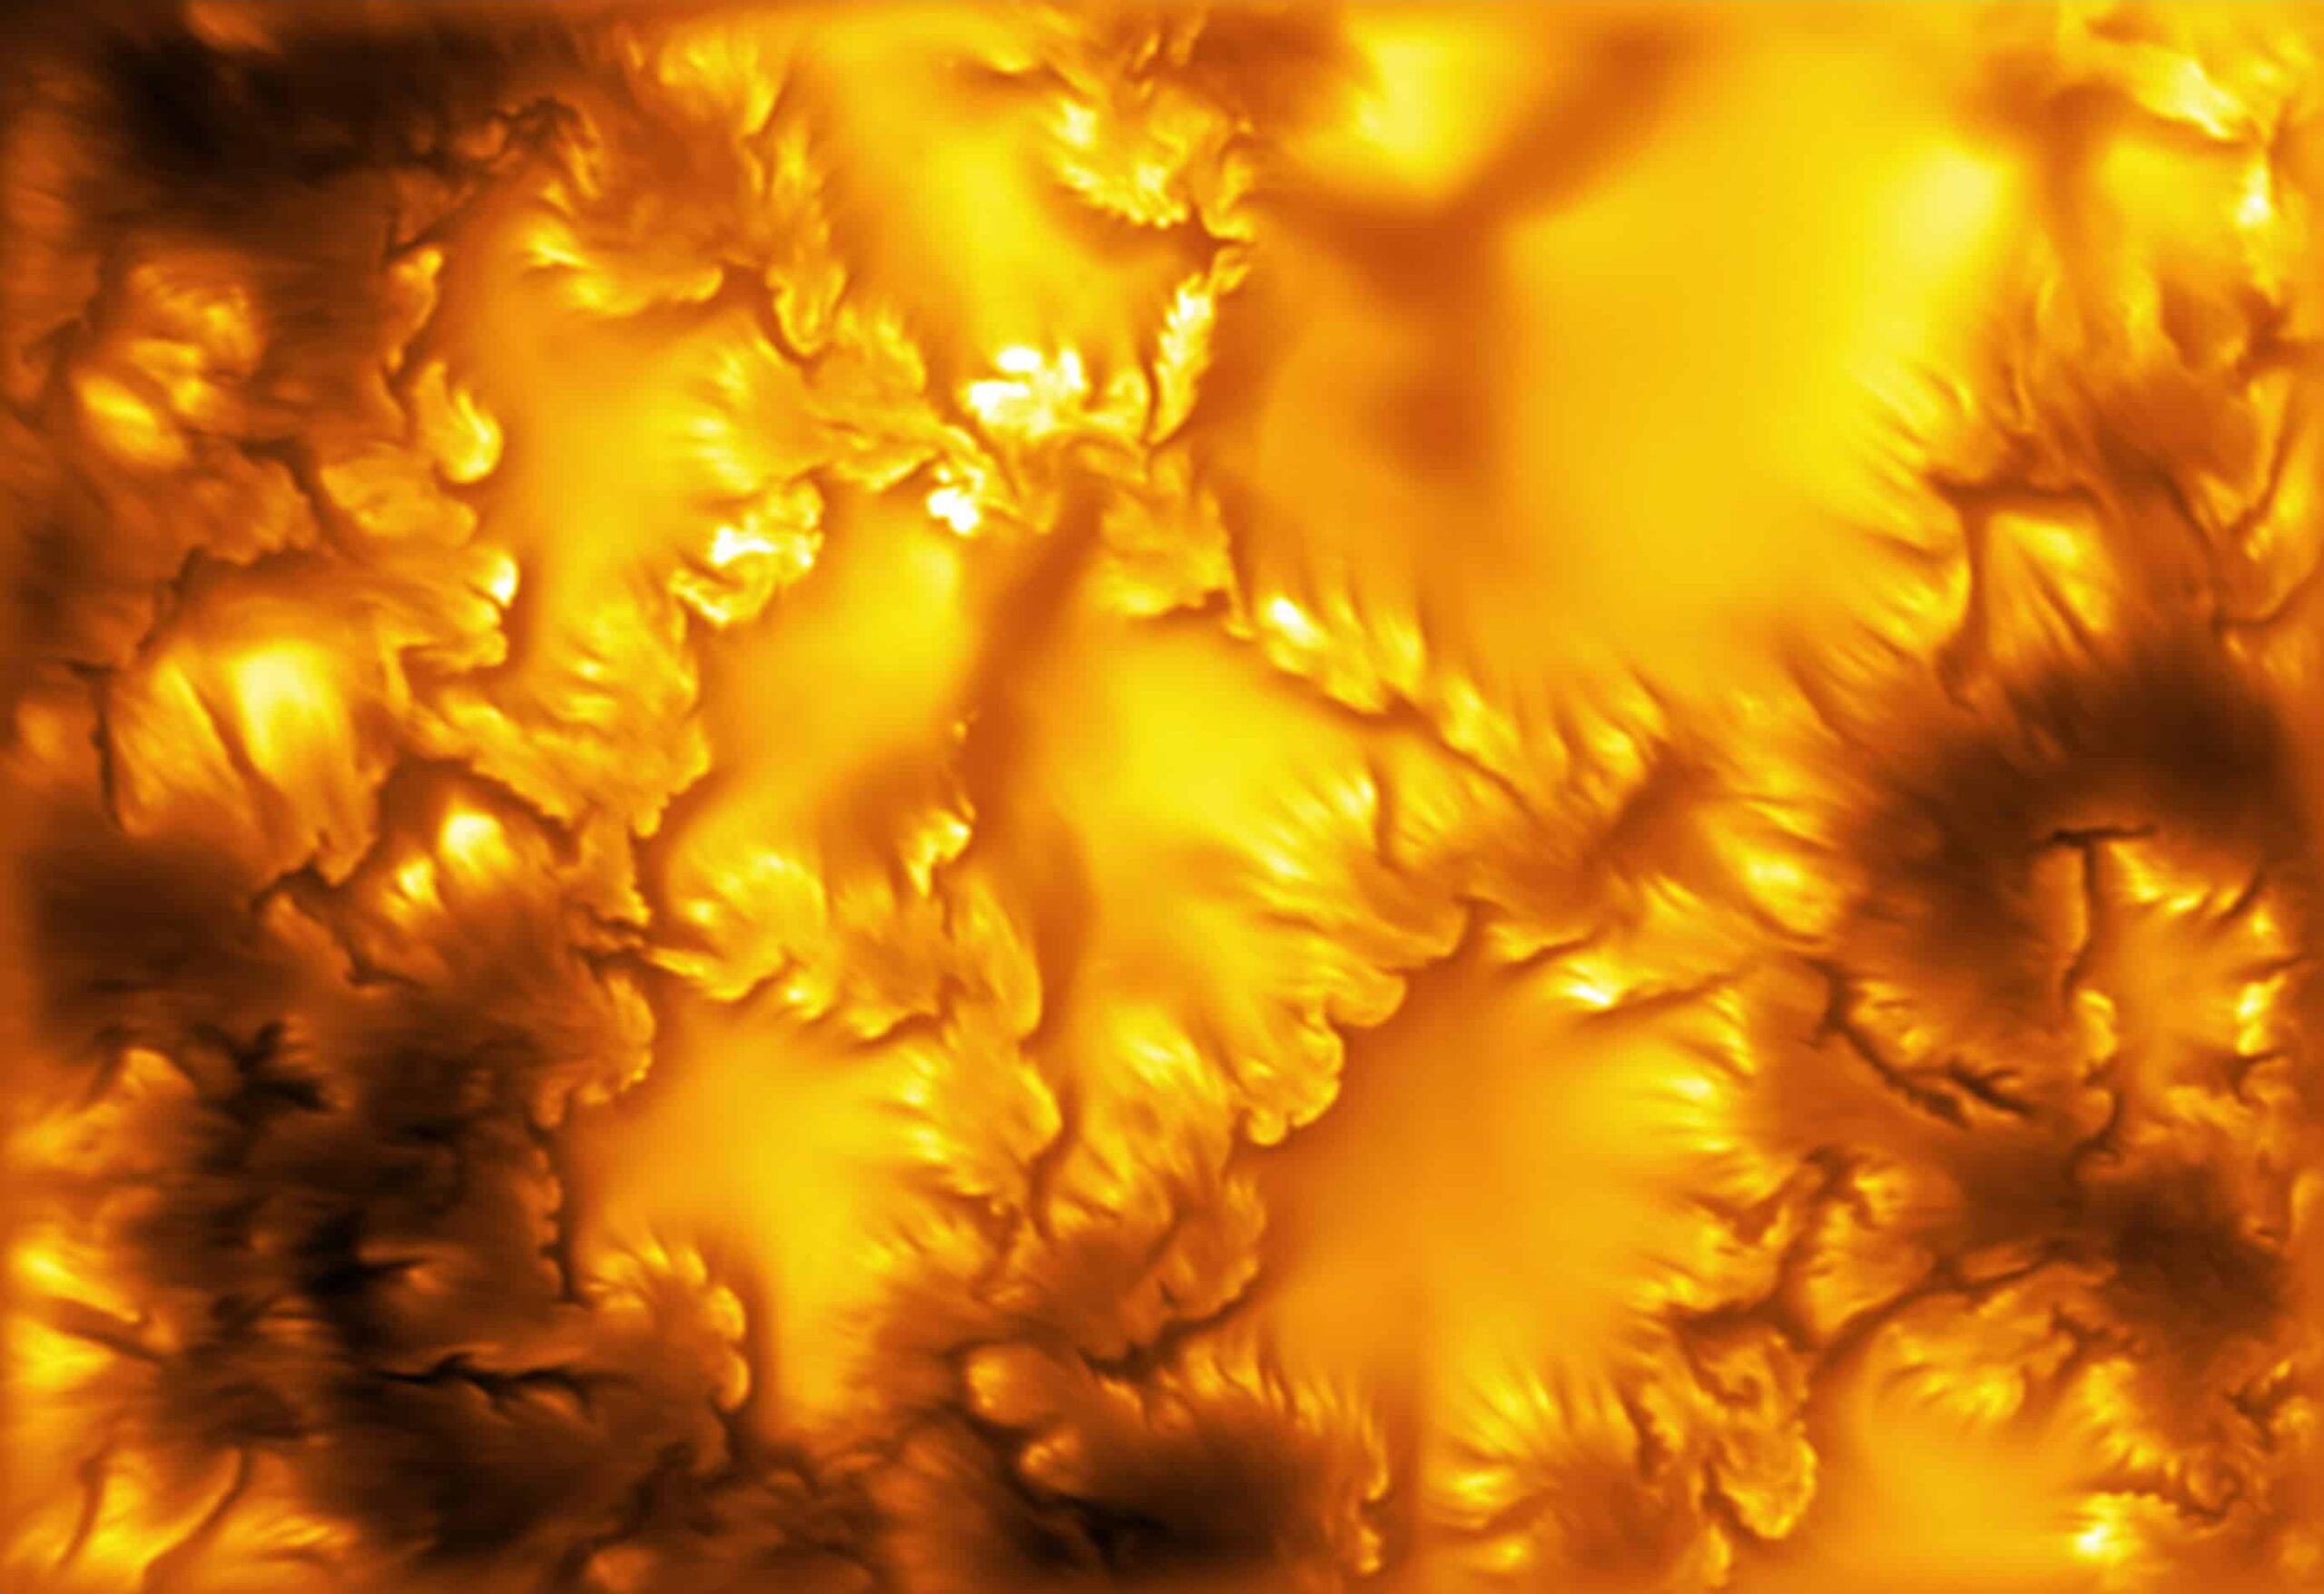
The curls in the new solar image look like waves breaking against a shore. There is no water, however, and the apparent shore is not solid. The scene is hot, magnetised plasma at the visible surface of the Sun, rolling up where neighbouring flows move at different speeds along the edges of concentrated magnetic fields.
The underlying process is the Kelvin–Helmholtz instability, or KHI. It appears when velocity shear makes a boundary between two flows unstable. Wind dragging across water can curl a wave. Different air currents can produce billowing clouds. Related shear instabilities shape structures in Jupiter’s atmosphere. The ingredients change; the fluid dynamics survives.
Solar physicists had expected KHI in the photosphere, but expectation is not observation. Earlier telescopes blurred the relevant boundaries into comparatively smooth lines. The Daniel K. Inouye Solar Telescope has now resolved those interfaces finely enough to show repeated waves, stripes and fully formed vortices, some only 25 kilometres across.
The August images came from three minutes in April 2025
The Nature paper, led by David Kuridze of the National Solar Observatory, was published on 5 August 2026. The observations themselves were made on 14 April 2025 between 21:38 and 21:41 UTC. “Published in August” and “photographed in August” are therefore not the same claim.
Inouye watched a region containing small dark pores near active region NOAA 14060, close to the centre of the solar disc. Pores are magnetically concentrated patches related to sunspots, but smaller and without a sunspot’s developed penumbra. Their strong fields inhibit some convective heat transport, making them appear darker than the surrounding photosphere.
A diagnostic FastCam recorded a small field at a wavelength of 416 nanometres, in the deep-blue part of visible light. It sampled the surface at about six kilometres per pixel and collected raw images at 740 frames per second with exposures of 100 microseconds. That speed helped freeze atmospheric distortion, but the published result was not one lucky snapshot.
The team used 2,000 calibrated frames to reconstruct each science image, removing residual distortions after the telescope’s adaptive optics had made their corrections. The final time sequence had a cadence of 2.7 seconds and reached an estimated spatial resolution of 19 kilometres. The familiar gold palette in the public image is false colour; the camera observed a narrow blue-continuum band.
Resolution, size and spacing are different numbers
The smallest-number headline can easily blur three separate measurements. Nineteen kilometres is the approximate spatial resolution of the reconstructed sequence. It describes the finest separation the telescope could reliably distinguish at that wavelength, not the diameter of every object in the frame.
The researchers analysed 47 vortex-bearing interfaces in the observations. The measured vortex sizes ranged from 25 to 170 kilometres. Twenty-five kilometres is therefore the lower end of the reported structures, close to the telescope’s resolving limit but still distinct from that limit.
The characteristic wavelength was about 65 kilometres. Here, “wavelength” means the typical distance between adjacent vortices along a corrugated boundary. It is not the wavelength of the blue light used to make the image, and it is not the size of a representative vortex.
Those distinctions also clarify Space Daily’s earlier account of the 20-kilometre frontier in the same Inouye dataset. That piece concentrated on what the record resolution might mean for coronal heating. The 25-kilometre figure in the present title refers specifically to the smallest vortices in the paper’s measured size distribution.
Why ocean swells and Jupiter belong in the same sentence
Kelvin–Helmholtz instability is named for William Thomson, Lord Kelvin, and Hermann von Helmholtz, who developed the relevant fluid theory in the nineteenth century. In its simplest form, two adjacent layers travel at different velocities. A small wrinkle in their boundary changes the pressure and flow around it, allowing the disturbance to grow. The boundary rolls into a train of waves and then into vortices.
A breaking ocean swell is a familiar visual analogy, particularly when wind moves over the water. Long bands of cloud can acquire the same repeated curls where air masses slide past one another. In the atmospheres of Jupiter and Saturn, strong neighbouring jets and cloud layers provide shear on a vastly larger scale.
The Sun adds magnetic fields and compressible, electrically conducting plasma. That makes the equations magnetohydrodynamic rather than those of ordinary water. Magnetism can also suppress KHI when the field lies parallel to the shear. In the observed plage region, however, the strong fields were mostly vertical while the important flows were horizontal, leaving the field poorly aligned to stabilise the boundary.
The comparison is therefore not merely visual. The curl has a common physical ancestry across ocean, atmosphere and star. Nor does it imply identical behaviour. Density, temperature, magnetic tension, gravity and characteristic scale determine how fast the instability grows and what happens after the first roll forms.
Granulation supplies the moving flows
The photosphere is the thin layer from which most visible sunlight escapes. Calling it a surface is useful, but the Sun has no ground beneath it. The layer is covered by granulation: bright cells where hot plasma rises, cools by radiating energy and moves outward before descending in darker lanes.
Individual granules are hundreds to roughly two thousand kilometres across, much larger than the new vortices. Magnetic flux becomes concentrated between and around them. Where convective flows sweep past the boundary of a strong magnetic element, neighbouring plasma can acquire a sharp difference in horizontal velocity.
In lower-resolution images, those boundaries looked blurred and largely smooth. Inouye revealed them as fringed, corrugated and populated by vortices. The National Solar Observatory’s release describes dynamic swirls occurring throughout the edges of magnetic areas in the observed field.
The time sequence matters. A static curl might be a chance intensity pattern. In the restored sequence, the deformation grew, propagated around magnetic elements and developed into recognisable vortices. Apparent horizontal speeds ranged from 0.67 to 3 kilometres per second in the tracked examples.
A wave-like photograph was not enough
Resemblance to a textbook Kelvin–Helmholtz wave is suggestive, not diagnostic. The camera measured brightness at one narrow wavelength. It did not directly record the horizontal velocity field needed to establish shear, and it did not supply a full three-dimensional magnetic map for every visible curl.
The researchers therefore compared the observations with radiation-magnetohydrodynamic simulations generated using the MURaM code. The model represented a small magnetic region of the photosphere on a grid spaced at 3.2 kilometres. Synthetic images were then processed so they could be compared with what Inouye would see.
The simulations produced similarly shaped vortices and fine dark striations at magnetic boundaries. Their characteristic spacing was about 50 kilometres, close to the observed 65. More importantly, the model exposed the horizontal velocity gradient along the boundary and showed the vortices physically bending magnetic flux.
Analytical KHI theory supplied a third check. The simulated shear layers were about 12 kilometres thick, and their measured density contrasts and velocity differences predicted the most unstable wavelengths between roughly 60 and 100 kilometres. Morphology, time evolution, simulation and theory converged on the same identification.
“First direct sighting” has a precise boundary
The 2026 result is not the first time Kelvin–Helmholtz instability has appeared anywhere in solar physics. It has been reported in the corona, in eruptive structures and where solar plasma meets planetary magnetic environments. Space Daily covered a 2024 case in which Parker Solar Probe imaged KHI in a coronal mass ejection and the solar wind.
This first is both smaller and lower. Kuridze and colleagues report the first direct confirmation of small, magnetised Kelvin–Helmholtz vortices in the photosphere, the Sun’s visible layer. The achievement depended on a four-metre mirror, high-speed imaging, adaptive optics and reconstruction working together at the telescope’s diffraction limit.
It is also a first in a selected scene. Inouye observed one magnetically active region close to disc centre for about three minutes. The paper calls the instability ubiquitous because vortex-like interfaces appeared widely across that field and the simulation generated many more. It does not mean every photospheric location is curling at every moment.
Billions of years is an inference, not an exposure time
No telescope watched these structures through the Sun’s history. The claim that similar instabilities have probably churned unseen for billions of years is an inference from the age of the Sun and the general nature of the mechanism.
The Sun is about 4.6 billion years old. It has sustained convection and generated magnetic fields through dynamo action for most of its main-sequence life. Wherever magnetic boundaries and differential plasma flows produced sufficient shear, Kelvin–Helmholtz instability would be an ordinary physical consequence rather than a phenomenon waiting for humans to invent a telescope.
The exact population of vortices will have changed with solar activity and stellar evolution. Conditions in the young Sun were not identical to those in active region NOAA 14060 in 2025. “Likely for billions of years” means that the ingredients are ancient and repeatable. It does not describe one continuous whirlpool, nor does the Nature paper reconstruct a four-billion-year record.
Small curls may alter large magnetic systems
In the simulations, the vortices mixed magnetised and less-magnetised plasma and produced an estimated turbulent diffusivity high enough to matter in strong-field regions where ordinary turbulence is usually suppressed. Deeper below the visible layer, the instability fragmented magnetic elements into smaller strands.
That mixing may help explain how magnetic flux disperses through the lower atmosphere. The vortex motion can also bend and braid field lines, storing free magnetic energy that may later be released by reconnection. This connects the result to flares, jets and the long-standing problem of how energy reaches the corona.
The connection remains a proposal to quantify, not a solved energy budget. Space Daily has also reported Inouye’s detection of twisting Alfvén waves in the corona, another mechanism capable of carrying energy through the solar atmosphere. Waves, reconnection and small-scale turbulent mixing may work together.
The immediate achievement is more grounded. A boundary that once looked smooth has become a moving chain of vortices. The same instability that curls water and planetary clouds is operating in magnetised plasma 150 million kilometres away, at scales solar telescopes had never directly resolved. The physics was probably present long before anyone could see it; the August 2026 images finally made it measurable.