
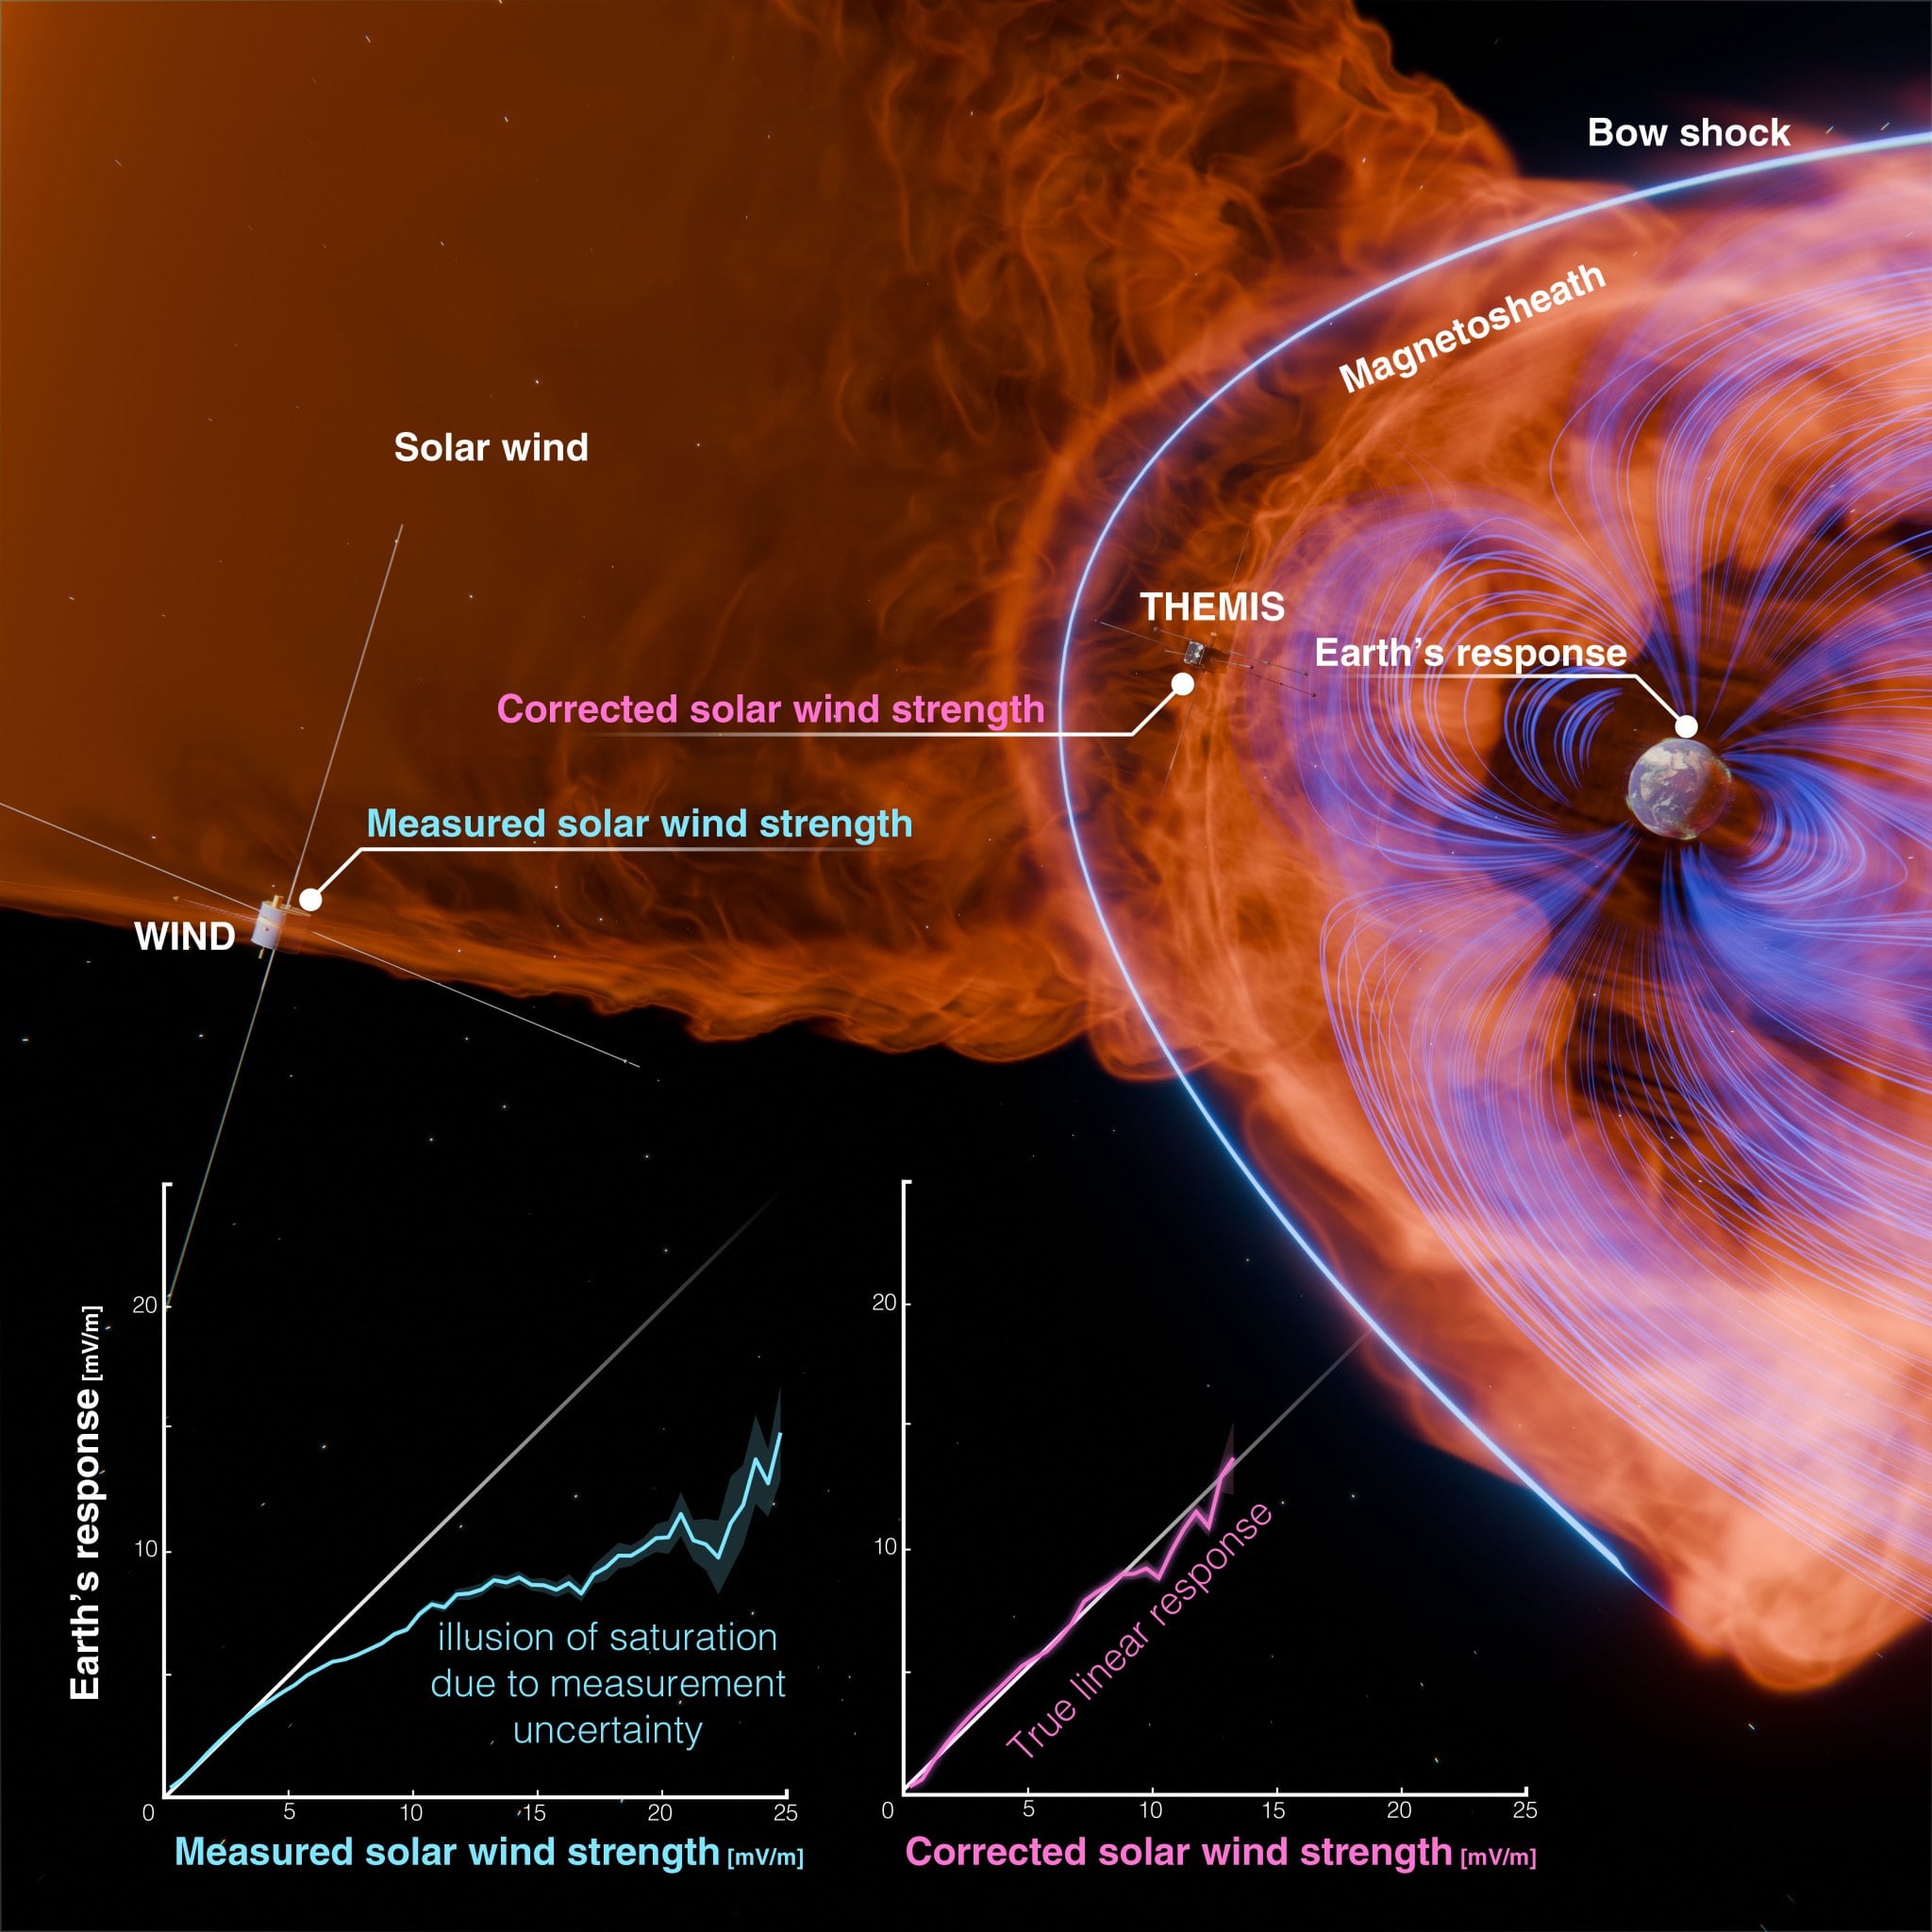
For years, one curve in space physics appeared to contain a piece of good news. When the solar wind drove Earth’s magnetic environment harder, electrical activity over the polar caps increased. At the strongest measured driving, however, the response seemed to bend away from a straight line and flatten.
The magnetosphere appeared to have a ceiling. A sufficiently violent solar storm could still be dangerous, but some physical process seemed to prevent Earth’s response from continuing to rise in proportion to the assault.
A NASA-led study published in Nature on 15 July 2026 argues that this comforting limit was largely drawn by measurement uncertainty rather than magnetospheric physics. Space physicist Nithin Sivadas of NASA Goddard and the Catholic University of America led the seven-author team. Once the researchers corrected a statistical bias in the solar-wind measurements, the response continued upward in an approximately straight line. At an extreme extrapolated driving strength, it could reach roughly twice the level inferred from the old saturated curve.
That finding deserves precision. The paper did not double the predicted value of every solar-storm effect, and it did not prove that Earth’s response can never saturate. It found no statistical evidence for saturation in the relationship it tested, through the range the observations can presently support.
The ceiling belonged to a particular electrical response
“Earth’s response” is broad enough to be misleading. The central comparison did not combine power-grid failures, satellite anomalies and auroral brightness into a single score. It concerned the way energy from the solar wind couples into the polar ionosphere.
On the input side was the solar-wind merging electric field, a quantity calculated from the solar wind’s speed and magnetic field. On the response side was the polar cap index, or PCI. The index is derived from ground magnetometers near the northern and southern poles and acts as a proxy for the dawn-to-dusk electric field over the polar cap. On average, it is proportional to the voltage difference across that region.
Early studies found that the PCI rose linearly as solar-wind driving strengthened. As more rare and powerful intervals accumulated, the average curve began to flatten at its high end. The apparent saturation of the cross-polar cap potential became a physical puzzle, and researchers developed at least ten theories to explain why the magnetosphere might throttle further energy transfer.
The new work does not begin with an eleventh throttling mechanism. It asks whether the curve needing an explanation was biased before the physics was interpreted.
The solar wind is measured a million miles too early
Space-weather monitors commonly sample the solar wind near the Sun-Earth L1 region, about 1.5 million kilometres sunward of Earth. That position is invaluable because it gives forecasters advance warning. NASA’s DSCOVR mission, for example, monitors the plasma and magnetic field there so alerts can be issued before a disturbance reaches the planet.
For the saturation question, however, the upstream measurement is not identical to the driver that ultimately acts on Earth. The Nature paper places L1 roughly 230 Earth radii upstream of the dayside reconnection site, where solar-wind and terrestrial magnetic fields exchange energy. Between those places, the flow travels through space, crosses Earth’s bow shock and is transformed inside the magnetosheath.
Researchers estimate an arrival time and shift the upstream data forward so it can be compared with the later polar response. Several uncertainties enter that operation. The propagation time from L1 is not exact. The delay between forcing at the bow shock and response in the polar ionosphere also varies. The wind has spatial structure, evolves during transit and changes as it passes through the shock.
This is not mainly a story about a broken instrument. It is a problem of definition: a good measurement at one place and time is being used as an uncertain estimate of a related physical condition somewhere else. The study calculated that the relative uncertainty in the driver estimate was at least 30 per cent and varied with the magnitude of the true value.
That distinction echoes a recent SpaceDaily examination of a NASA solar-storm forecast. Its central arrival time matched the recorded shock to the minute, yet the ensemble had honestly spanned more than 22 hours. Solar-wind uncertainty is not an asterisk added after the result. It is part of the physical inference.
How uncertainty can manufacture a plateau
The key statistical idea is regression to the mean. Suppose an extreme value is measured in a process where moderate values are common, extreme ones are rare and the measurement has substantial random uncertainty. The true value associated with that observation is more likely to be somewhat less extreme, closer to the crowded middle of the distribution.
The authors note that “regression to the more-probable” is the more general description. Solar-wind quantities often follow a log-normal distribution, and the size of the uncertainty changes with the strength of the driver. These features make the bias nonlinear.
An unusually high value recorded upstream at L1 will therefore often correspond to a less extreme value by the time and place where the solar wind actually drives the magnetosphere. Earth’s smaller response is then plotted against the larger upstream measurement. The farther into the rare tail the measurement goes, the wider the likely mismatch becomes. Repeated across many events, a genuinely linear response can appear to flatten.
The team represented the uncertain measurement as the true, near-Earth driver shifted by uncertain delays and altered by a random magnitude error. It then built a Monte Carlo model from the measured distributions of those uncertainties. The model produced a saturating curve strikingly similar to the one in 25 years of observations from 1995 to 2019, without requiring a physical saturation mechanism.
NASA’s summary of the study says the researchers also analysed more than a million measurements taken closer to Earth by missions including MMS and THEMIS. Those data supported a direct relationship between solar-wind strength near Earth and the electrical response.
The straightened curve has an observed limit of its own
After estimating the bias, the researchers applied a method called regression calibration. Instead of treating the upstream value as the true driver, the method estimates the most likely actual driving strength behind it. When the PCI was plotted against that corrected input, the flattened green curve became an approximately linear purple one.
The result held up to corrected solar-wind driving of about 15 millivolts per metre. The team then applied the same correction to the westward auroral electrojet, measured through the independently constructed SuperMAG index. That relationship also became linear, reducing the chance that the result was merely an oddity in how the PCI itself was defined.
Beyond 15 millivolts per metre, the observations become too sparse to establish the curve’s shape. The paper’s “twice the impact” result refers to extrapolating the linear relationship to approximately 25 millivolts per metre and comparing it with the older saturated estimate at the same driving strength.
That makes “up to twice as hard” a reasonable summary of the study’s extreme scenario, but not a direct observation of a storm at 25 millivolts per metre. The authors explicitly allow that saturation could occur at strengths not yet observed. Their sharper claim is that the available measurements do not currently demonstrate such a ceiling.
Twice the geomagnetic response is not twice every consequence
A stronger polar electric field can support stronger currents in the upper atmosphere. Rapid changes in Earth’s magnetic environment can in turn induce voltages in long conductors at the surface. Satellites can experience charging and orientation problems, the upper atmosphere can expand and increase orbital drag, and radio or navigation signals crossing the ionosphere can be degraded.
NOAA’s space-weather scales describe those possible consequences, but they do not create a simple one-to-one conversion from the PCI to damage. A grid’s exposure depends on latitude, local geology, storm duration, transformer design and the orientation and rate of magnetic change. A satellite’s outcome depends on its orbit, shielding, operating state and the particle and plasma environment it encounters.
The new paper therefore does not mean a blackout area, navigation error or satellite-drag increase should automatically be multiplied by two. It removes one reason for expecting the magnetosphere’s large-scale electrical response to soften as the driving grows. Translating that larger response into risks for specific systems remains an engineering and forecasting problem.
The historical reason to care is visible in SpaceDaily’s account of the 1859 Carrington Event. Telegraph operators disconnected their batteries, yet storm-induced current continued to move through the wires. The infrastructure was primitive, but the coupling from changing geomagnetic fields into a technological network was already unmistakable.
Extreme events are exactly where the data are thinnest
The difficulty is that the storms most capable of settling the high end of the curve are, by definition, rare. Earth also has to be in the path, and useful instruments must be operating in the right places.
SpaceDaily has previously examined the July 2012 eruption measured by STEREO-A. The spacecraft encountered the extreme plasma and magnetic structure because the eruption missed Earth. It supplied unusually valuable evidence about a Carrington-class event, but Earth did not provide a simultaneous geomagnetic response to compare with it.
The 2026 paper draws strength from multiple spacecraft and two independent ground response measures, but it remains a statistical calibration rather than a controlled experiment. Its error model assumes distributions for timing, variability and the near-Earth driver, then tests whether the resulting synthetic relationship matches the observations. The match is strong, and the calibration straightens both response measures, but more direct observations of genuinely extreme driving remain the decisive evidence to seek.
Ten theories now face a different test
The authors do not claim that every piece of physics contained in the ten saturation theories is false. Magnetospheres are nonlinear systems, and individual mechanisms may still operate under particular conditions. The problem is that those theories were asked to explain a flattened relationship that the corrected data no longer show.
Any old or new saturation model must now reproduce the calibrated, approximately linear response through the observed range before predicting where a real ceiling should emerge. This reverses the burden of explanation. The plateau can no longer be treated as an established fact that merely needs a mechanism.
The statistical lesson extends beyond space weather. When the uncertain input to a system is plotted against an outcome, rare measured extremes can be systematically paired with outcomes produced by less extreme true inputs. A curve may bend not because nature has changed regime, but because uncertainty grows precisely where observations are scarcest.
For geomagnetic storms, that correction removes a reassuring assumption from the data. Earth still has a magnetosphere, and it remains an extraordinary shield. What the 2026 analysis takes away is the expectation that this shield must automatically cap the electrical response as an extreme solar wind pushes harder. At the edge of what has been observed, the line keeps rising.