
The Moon’s polar darkness may hold a practical route to longer missions. Water ice trapped in terrain that never receives direct sunlight could supply drinking water, oxygen and, after further processing, hydrogen and oxygen rocket propellant.
The difficulty is deciding where to look. Lunar observations were collected by different instruments at different resolutions, wavelengths and illumination angles. NASA and IBM have now released an open model designed to connect those records and turn them into adaptable mapping tools.
According to NASA’s release of the Lunar Foundation Model, the system was pretrained on roughly two million lunar image tiles. The associated unified dataset contains more than 30 spatially aligned layers from nine instruments flown on four missions.
Permanent shadow creates a lunar archive
The Moon’s spin axis is tilted by only about 1.5 degrees. Near either pole, the Sun therefore stays close to the horizon. A crater rim may catch prolonged light while its floor remains hidden behind surrounding topography throughout the year.
These permanently shadowed regions can become cold traps. Water molecules delivered by impacts or created through interactions between solar-wind hydrogen and lunar minerals may migrate until they reach ground cold enough to keep them frozen for extremely long periods.
SpaceDaily’s earlier account of how missions established the case for polar water ice explains why a cold trap is neither a lake nor a guaranteed deposit. Ice may be mixed into regolith, concentrated in patches, covered by dry material or missing from some thermally suitable ground.
A foundation model is a starting point
A conventional machine-learning project might begin by labelling many examples for one task, then training a specialist model. A foundation model first learns broad structure from a much larger, mostly unlabelled dataset. Researchers can then fine-tune it using a smaller labelled collection.
The lunar system is a vision transformer encoder-decoder trained from scratch. Its public model card describes a masked-token objective: selected portions of the inputs are hidden, encouraging the model to learn relationships among terrain, imagery and other aligned observations.
That broad representation supports three initial scientific tasks. The team tested crater detection, segmentation of unusual volcanic landforms called irregular mare patches, and regression of polar ice prospectivity. Each requires a different output, but all begin from the same pretrained lunar backbone.
Two million tiles span two very different scales
The training count does not mean two million independent photographs. It refers to co-registered tile bundles cut from larger lunar products. NASA reports more than one million high-resolution camera tiles at about one metre per pixel and nearly 964,000 multispectral tiles at about 100 metres per pixel.
Most training information came from the Lunar Reconnaissance Orbiter, which has mapped the Moon since 2009. Complementary data came from NASA’s GRAIL and Lunar Prospector missions and JAXA’s SELENE, also known as Kaguya.
The more-than-30 figure describes all spatially aligned layers in the machine-learning-ready lunar dataset. The pretrained model card describes about two million bundles spanning 11 modalities across the high-resolution Narrow Angle Camera and lower-resolution Wide Angle Camera families.
Those are related but not interchangeable numbers. A data layer is a mapped property or observation type. A modality is an input channel family presented to the network. A tile is a geographic sample extracted from those larger layers.
Lighting geometry cannot be treated as noise
Polar illumination is a serious confounder. The same terrain can look dramatically different when the low Sun changes direction, and darkness in an optical image does not by itself identify composition or temperature.
The model therefore receives acquisition geometry as explicit context, including illumination angles, a solar-frame anchor and the tile footprint. That supplies facts already recorded for each observation instead of forcing the network to reconstruct them from shadows.
Mixed-resolution pretraining lets one set of weights handle the roughly hundredfold gap between the two image scales. Modality-specific tokenization also allows different measurement types to enter a shared representation without pretending that a camera image and a terrain map are equivalent.
The ice benchmark produced the clearest advantage
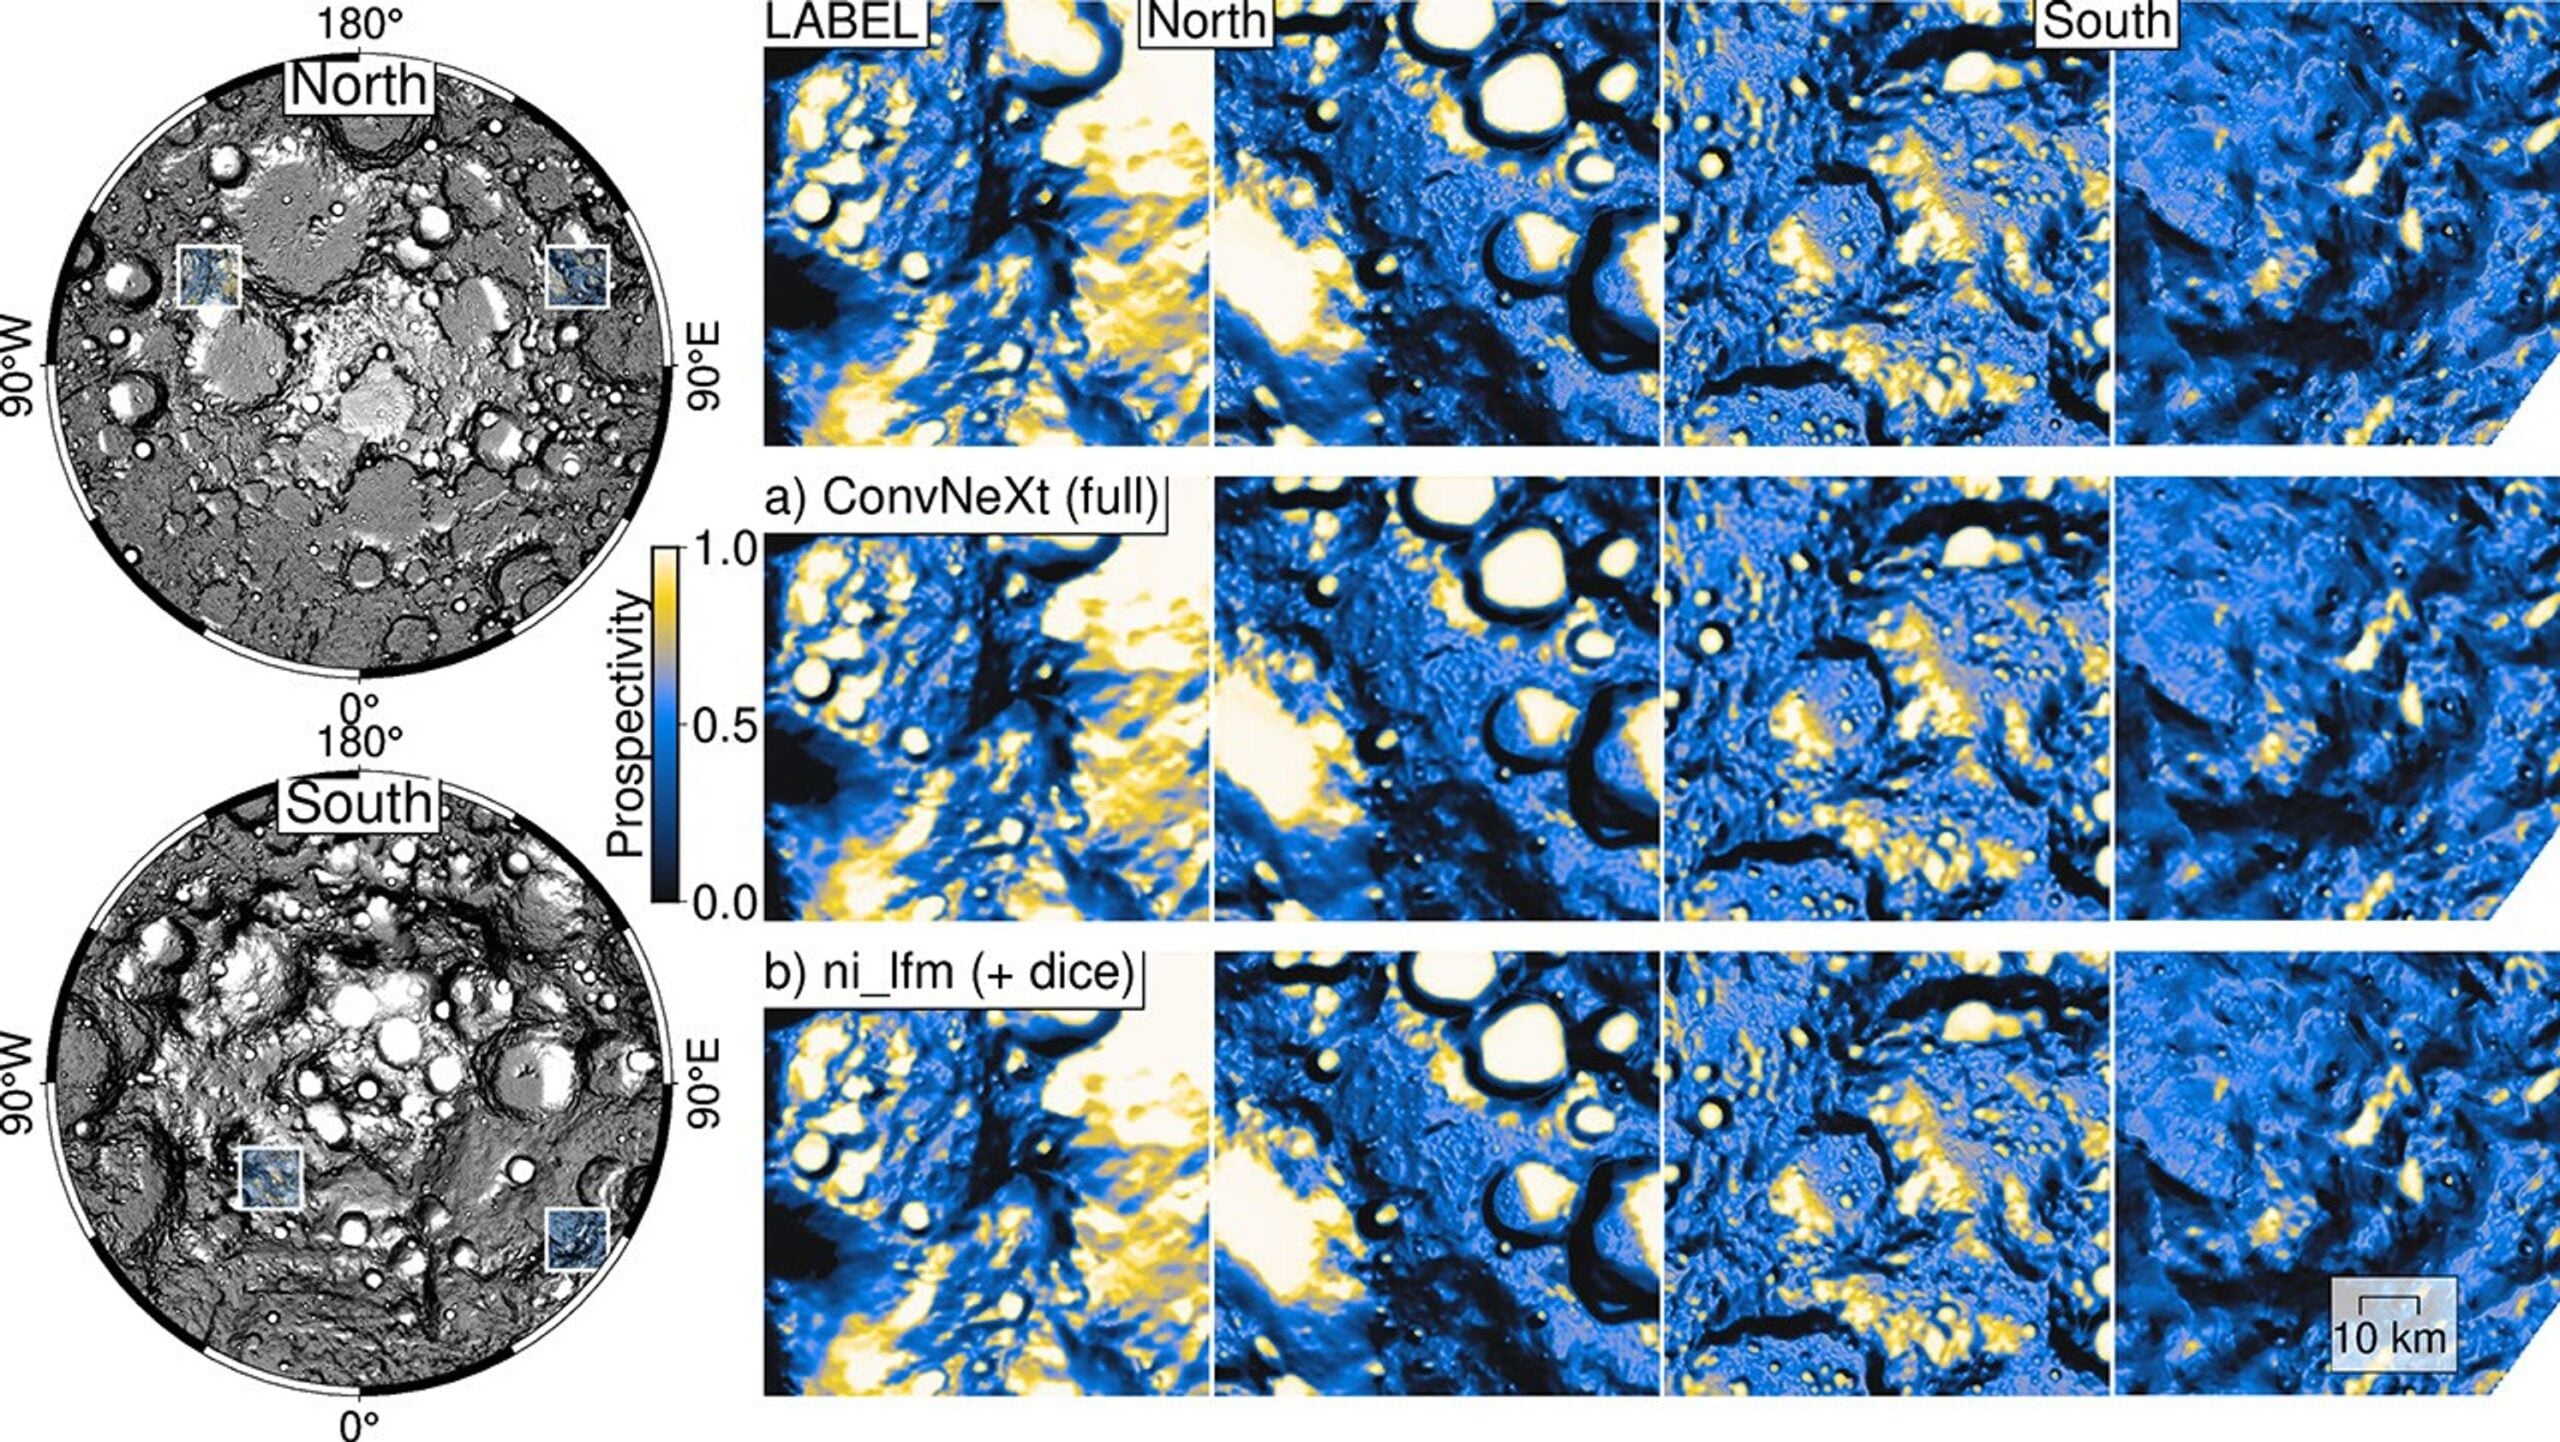
For ice prospectivity, the inputs represented factors including slope, aspect, maximum temperature, permanently shadowed regions, distance to shadow and estimated ice-stability depth. The target was a continuous map scored from low to high prospectivity.
The best fully fine-tuned lunar model recorded a root mean squared error of 0.0293, compared with 0.0377 for SwinV2-B, the strongest baseline in that table. Because lower RMSE is better, the difference amounts to roughly a 22 percent reduction in error.
An IBM announcement summarized the margin as an improvement in identifying areas with high potential for lunar ice. The fuller description matters: the benchmark evaluated agreement with an ice-prospectivity reference, not identification of verified deposits in drilled lunar soil.
The test protocol held the dataset splits, loaders, decoder, output head and evaluation metric constant across the compared encoders. Reported results are averages over repeated runs, reducing the chance that the advantage came from one favourable random initialization.
The map predicts stability, not an ice reserve
The released polar benchmark covers terrain within roughly 10 degrees of each pole at 240 metres per pixel. Its reference target is a knowledge-driven fuzzy-overlay prospectivity product built from several evidential layers.
This means the AI is learning to reproduce a physically motivated model of favourable conditions. The benchmark card warns that the target is tunable and may change as assumptions improve. Sparse ground truth and extreme illumination also make evaluation sensitive to labels and metrics.
Yellow on the output image therefore does not mean a measured quantity of water. It means the combined inputs resemble terrain assigned high prospectivity by the reference workflow. Confirmation still requires independent observations and, ultimately, measurements at the surface or below it.
The input-ablation tests reinforce that distinction. Slope and aspect alone left both the pretrained model and its untrained counterpart with errors around 0.2. Terrain shape by itself was not enough to reconstruct the reference prospectivity pattern.
Adding the estimated ice-stability layer produced the largest early improvement. With three input types, the lunar model reached an RMSE of 0.0434, essentially matching a conventional ConvNeXt baseline that received the full eight-layer input stack. Pretraining was most useful when evidence was sparse, not only when every map was available.
Other tasks reveal a more mixed scorecard
NASA says the model matched or exceeded strong baselines across all evaluated tasks, but the size of the advantage varied. It improved broad Wide Angle Camera crater detection in the reported settings and performed almost identically to the best baseline for metre-scale Narrow Angle Camera craters.
For irregular mare patches, its intersection-over-union score was comparable to the leading specialist model. These features matter because their apparently youthful surfaces complicate estimates of when lunar volcanism ended, but imperfect labels make their exact boundaries difficult to teach.
The IBM Research account notes that lightweight adapters could leave about 90 percent of the base weights frozen during fine-tuning. The point of a foundation model is not guaranteed supremacy on every task. It is reuse: one lunar representation can be adapted without rebuilding the entire system each time.
A better map still leaves a hard mining problem
Before ice becomes a resource, missions must determine its concentration, depth, physical form and continuity. Machinery then has to excavate or heat material in deep cold, operate without direct sunlight, tolerate abrasive dust and move water or propellant to where crews can use it.
If accessible water exists in workable deposits, electrolysis can split it into hydrogen and oxygen. Oxygen could support life or serve as a rocket oxidizer. Hydrogen paired with oxygen can fuel high-performance engines. Producing, liquefying and storing those gases, however, demands substantial power and cryogenic equipment.
That is the connection to Mars expeditions. Local propellant could reduce some mass launched from Earth’s deep gravity well and support a lunar transport system. The prospect depends on engineering and economics as much as geology, and the new model does not estimate mineable reserves.
Polar ice is also a scientific archive. Its chemistry may record impacts, solar-wind interactions and the movement of volatile molecules across an airless body over long intervals. Excavating a promising patch before documenting its context could erase information that cannot be restored.
A prospectivity model can help rank places for closer study, including sites where resource potential and scientific value overlap. It cannot decide how much terrain should be sampled, protected or mined. Those choices require mission measurements, preservation rules and priorities outside the network’s training objective.
The release is open, but not an operational navigator
The checkpoint is hosted on Hugging Face, and NASA has released fine-tuning and inference code on GitHub. The model and code use an Apache 2.0 licence, while the benchmark datasets carry their own open data licences.
The release is not unlimited. Its documentation says generated fields are not calibrated scientific products, the model has no absolute geodetic reference frame, and outputs are not validated for landing-site certification or hazard clearance. The public repository also omits the original pretraining code.
Those boundaries make the system a research platform, not an autonomous mission planner. Open weights, test collections and repeatable fine-tuning configurations let other teams challenge the scores, expose regional failures and build better specialist tools.
The important step is integration. Decades of lunar observations can now be queried through a common learned representation instead of remaining isolated by instrument and scale. On the ice benchmark, that representation produced the clearest map-level advantage, while the ground beneath each bright prediction still waits for direct confirmation.