
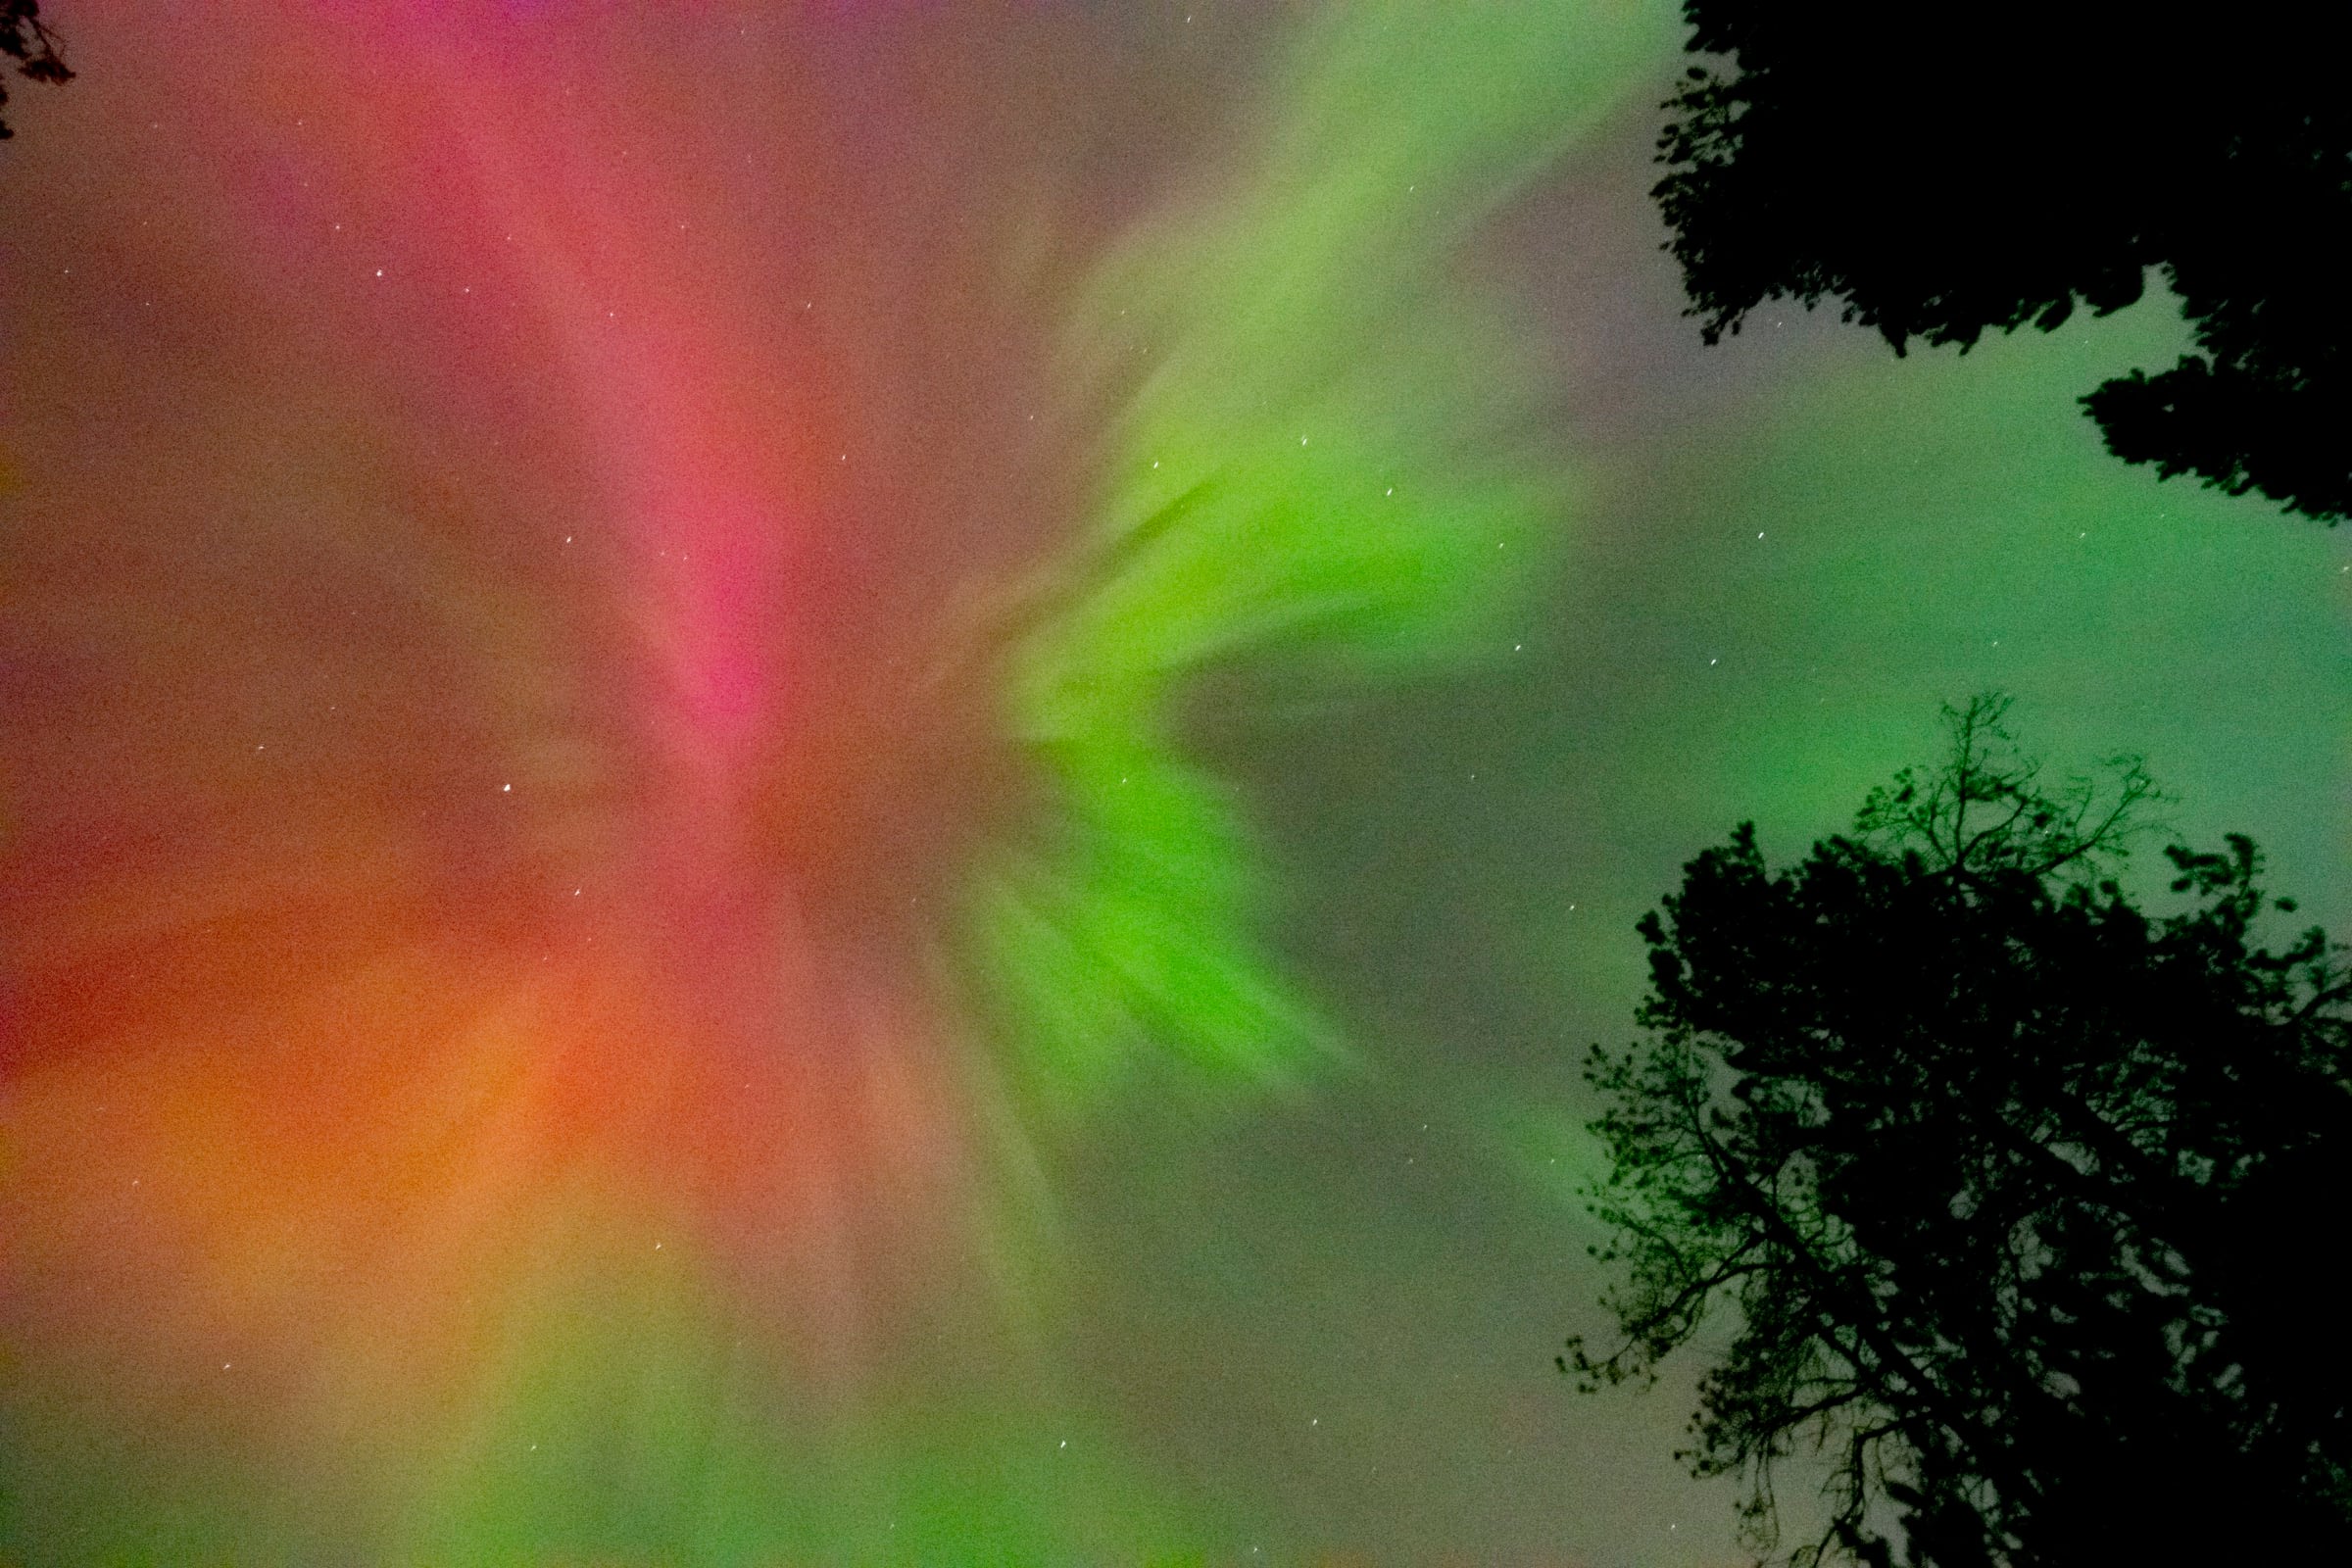
For millions of people, the Gannon storm arrived as colour. Red auroras appeared over Mexico, blue and purple structures were photographed across Japan, and the southern lights spread over Australia on 10 and 11 May 2024.
For Japan’s Arase satellite, the same event looked like subtraction. A dense reservoir of electrically charged material surrounding Earth was being eroded from the outside inward. Within nine hours, the measured plasmapause moved from an L-shell near 7 to one near 1.5.
That change placed the boundary at roughly one-fifth of its earlier radial distance from Earth’s centre. It was an extraordinary contraction, but a carefully defined one. The result concerns the plasmasphere, not the whole magnetosphere, and a radial distance is not the same as a volume. Understanding those distinctions reveals why this storm was scientifically richer than even its photographs suggest.
The strongest geomagnetic storm since 2003
The chain began at the Sun. Active region 13664 released repeated powerful flares and several Earth-directed coronal mass ejections from 8 May. Those ejections carried clouds of plasma and embedded magnetic fields across the 150-million-kilometre gap between the Sun and Earth.
The first interplanetary shock reached Earth’s magnetic environment at about 17:05 UTC on 10 May. Solar-wind density and speed jumped, while the magnetic field carried by the solar wind repeatedly pointed south. That orientation matters because it couples efficiently with Earth’s oppositely directed field, transferring energy into the magnetosphere through magnetic reconnection.
The planetary Kp index reached 9, corresponding to G5, the highest category on NOAA’s geomagnetic-storm scale. It was the first G5 event since the Halloween storms of October 2003. NASA’s event record lists a peak Dst of -412 nanoteslas, while the higher-time-resolution SYM-H index used in the later plasmasphere study fell to -518 nanoteslas.
Those numbers are related measures of the disturbance, not interchangeable scores. They help explain why descriptions vary from “strongest in two decades” to comparisons with the 1989 storm. The unambiguous point is that May 2024 produced the first G5 conditions in more than 20 years and the most intense geomagnetic storm of Solar Cycle 25 to that date.
The event is called the Mother’s Day storm in many accounts. The name Gannon honours Jennifer Gannon, a space-weather physicist whose work focused on understanding and reducing the risks posed by geomagnetic disturbances.
The plasma cocoon inside the magnetic shield
Earth’s magnetosphere is the vast region in which the planet’s magnetic field dominates the motion of charged particles. Inside it lies the plasmasphere, a doughnut-like region filled with relatively cool, dense plasma drawn largely from the upper ionosphere. This material rotates with Earth and is bounded by a sharp density transition called the plasmapause.
The boundary is often described using an L-shell. An L value identifies a magnetic field line by the distance, measured in Earth radii, at which it crosses the magnetic equator. L equals 7 therefore corresponds to about 44,600 kilometres from Earth’s centre. L equals 1.5 is about 9,600 kilometres from the centre, or only around 3,200 kilometres above the surface at the magnetic equator.
That is the basis of the “one-fifth” comparison. The 2025 Earth, Planets and Space study, led by Atsuki Shinbori of Nagoya University, found the plasmapause moving from L=7 to L=1.5 within nine hours of the storm’s sudden commencement. Dividing 1.5 by 7 gives about 0.21.
It would be misleading to say that Earth’s entire magnetic shield became one-fifth its normal size. The magnetopause, the outer boundary on the Sun-facing side, is a different structure and was measured near seven Earth radii during part of the event. Nor did the plasmasphere retain one-fifth of its previous volume. The paper reported how far the plasmapause extended radially along Arase’s sampled paths.
How Arase watched the boundary collapse
Arase, launched by the Japan Aerospace Exploration Agency in 2016, follows an elongated orbit through the inner magnetosphere. Its Plasma Wave Experiment detects naturally occurring radio and plasma waves. The upper frequency limit of one type, called upper-hybrid resonance, allows researchers to calculate the local electron density.
Shinbori’s team assembled those one-minute density estimates into a picture of how the inner magnetosphere changed with time and distance. They defined a plasmapause crossing where electron density dropped by at least a factor of three over less than half an L-shell. The satellite’s 9.42-hour orbit supplied inbound and outbound passes through different local-time sectors.
The most striking result was the rapid motion to L=1.5. A separate measure in the paper showed the region with more than 300 electrons per cubic centimetre contracting from L=4 to L=2.5 within a day, while density between L=2.5 and 3 fell by about an order of magnitude. These measurements describe severe erosion, not the disappearance of every charged particle outside a neat spherical edge.
Powerful storm-time convection electric fields had overwhelmed the quieter pattern that normally helps plasma co-rotate with Earth. Material was transported outward, the plasmapause was pushed inward and energetic particles gained access to parts of the inner magnetosphere they reach less readily under ordinary conditions.
A four-day refill with a depleted reservoir
The plasmasphere can rebuild after a storm. Plasma from the ionosphere moves upward along magnetic field lines and gradually refills depleted flux tubes as geomagnetic convection weakens.
This time the process was unusually slow. The study measured refilling times of 4.70 days on Arase’s inbound passes and 4.31 days on its outbound passes. Its operational definition was the interval from the start of the density loss until electron density recovered to more than half its pre-storm level.
Ground-based Global Navigation Satellite System receivers supplied the other half of the explanation. By measuring the delay imposed on two navigation frequencies, the researchers mapped total electron content in the ionosphere and compared it with ten quiet days. After early regional enhancements, electron content became depleted across much of the globe during the recovery phase.
The team linked that negative ionospheric storm to changes in the upper atmosphere’s composition driven by intense energy input at high latitudes. With fewer ionospheric electrons available to flow upward, the plasmasphere’s source reservoir was diminished. The timing does not establish every step of the mechanism on its own, but the parallel depletion and delayed refill support that interpretation.
When auroral ovals reached Mexico, Japan and Australia
While Arase sampled an invisible density boundary, the storm made another part of near-Earth space impossible to miss. Enhanced currents, substorms and particle precipitation expanded the auroral ovals towards the equator. Charged particles following magnetic field lines collided with oxygen and nitrogen in the upper atmosphere, making those gases emit light.
In Mexico, a Space Weather study assembled photographs from 45 locations and reported red auroras in unusually low-latitude states. One documented display near Colima lay at 19.4 degrees geographic latitude, or about 27.5 degrees magnetic latitude. The event lasted more than 40 hours and gave Mexico’s developing space-weather instrument network its first opportunity to measure a disturbance of this scale.
Japan saw auroras not only over Hokkaido but across northern and central Honshu. An open-access analysis of photographs from two citizen scientists reconstructed a blue-dominant structure near 40 degrees magnetic latitude. It extended roughly 1,200 kilometres longitudinally and from about 400 kilometres to at least 900 kilometres in altitude.
Australia received the southern counterpart. The Bureau of Meteorology recorded G5 planetary conditions on 11 May and G4 conditions in the Australian region that evening. Displays were widely photographed across southern Australia and at locations far north of the usual Tasmanian viewing zone. “Across Australia” describes the breadth of reports, not uniform naked-eye visibility from every city; cloud, darkness, light pollution and camera sensitivity all affected what observers saw.
Modern cameras are more sensitive than human night vision, especially to deep red auroral emissions. NASA accordingly treated thousands of public photographs as valuable data while warning that historical comparisons remain difficult. Its initial assessment placed credible reports as low as 26 degrees magnetic latitude and described the display as a possible rival to the lowest-latitude events of the past five centuries.
One disturbance, many boundaries
The colourful sky and the compressed plasmasphere were not two versions of one measurement. They were connected consequences of energy entering a coupled system. Auroras recorded collisions in the upper atmosphere. Arase recorded electron density thousands of kilometres higher. Ground navigation receivers traced the ionospheric reservoir linking the atmosphere to the inner magnetosphere.
This is why the Gannon storm matters beyond its photographs. It gave researchers a rare, instrument-rich test of how models handle abrupt erosion, low-latitude particle access and slow recovery. As SpaceDaily recently reported, a 2026 analysis also challenged the idea that Earth’s response simply saturates as solar driving grows stronger. Extreme events may continue pushing the system beyond relationships inferred from ordinary storms.
The May 2024 event caused navigation and radio degradation, satellite anomalies and operational disruption for some precision-GPS users, but no catastrophic public damage. That outcome should not be confused with a harmless storm. It means a severe natural experiment arrived during an era of unusually dense observations and exposed where the models, measurements and infrastructure assumptions still need work.
From the ground, the storm looked like aurora where aurora did not belong. From Arase, it looked like a plasma boundary racing towards Earth. Together, those views show that space weather is not something happening vaguely above the atmosphere. It is the atmosphere, ionosphere and magnetosphere responding as one connected environment.