

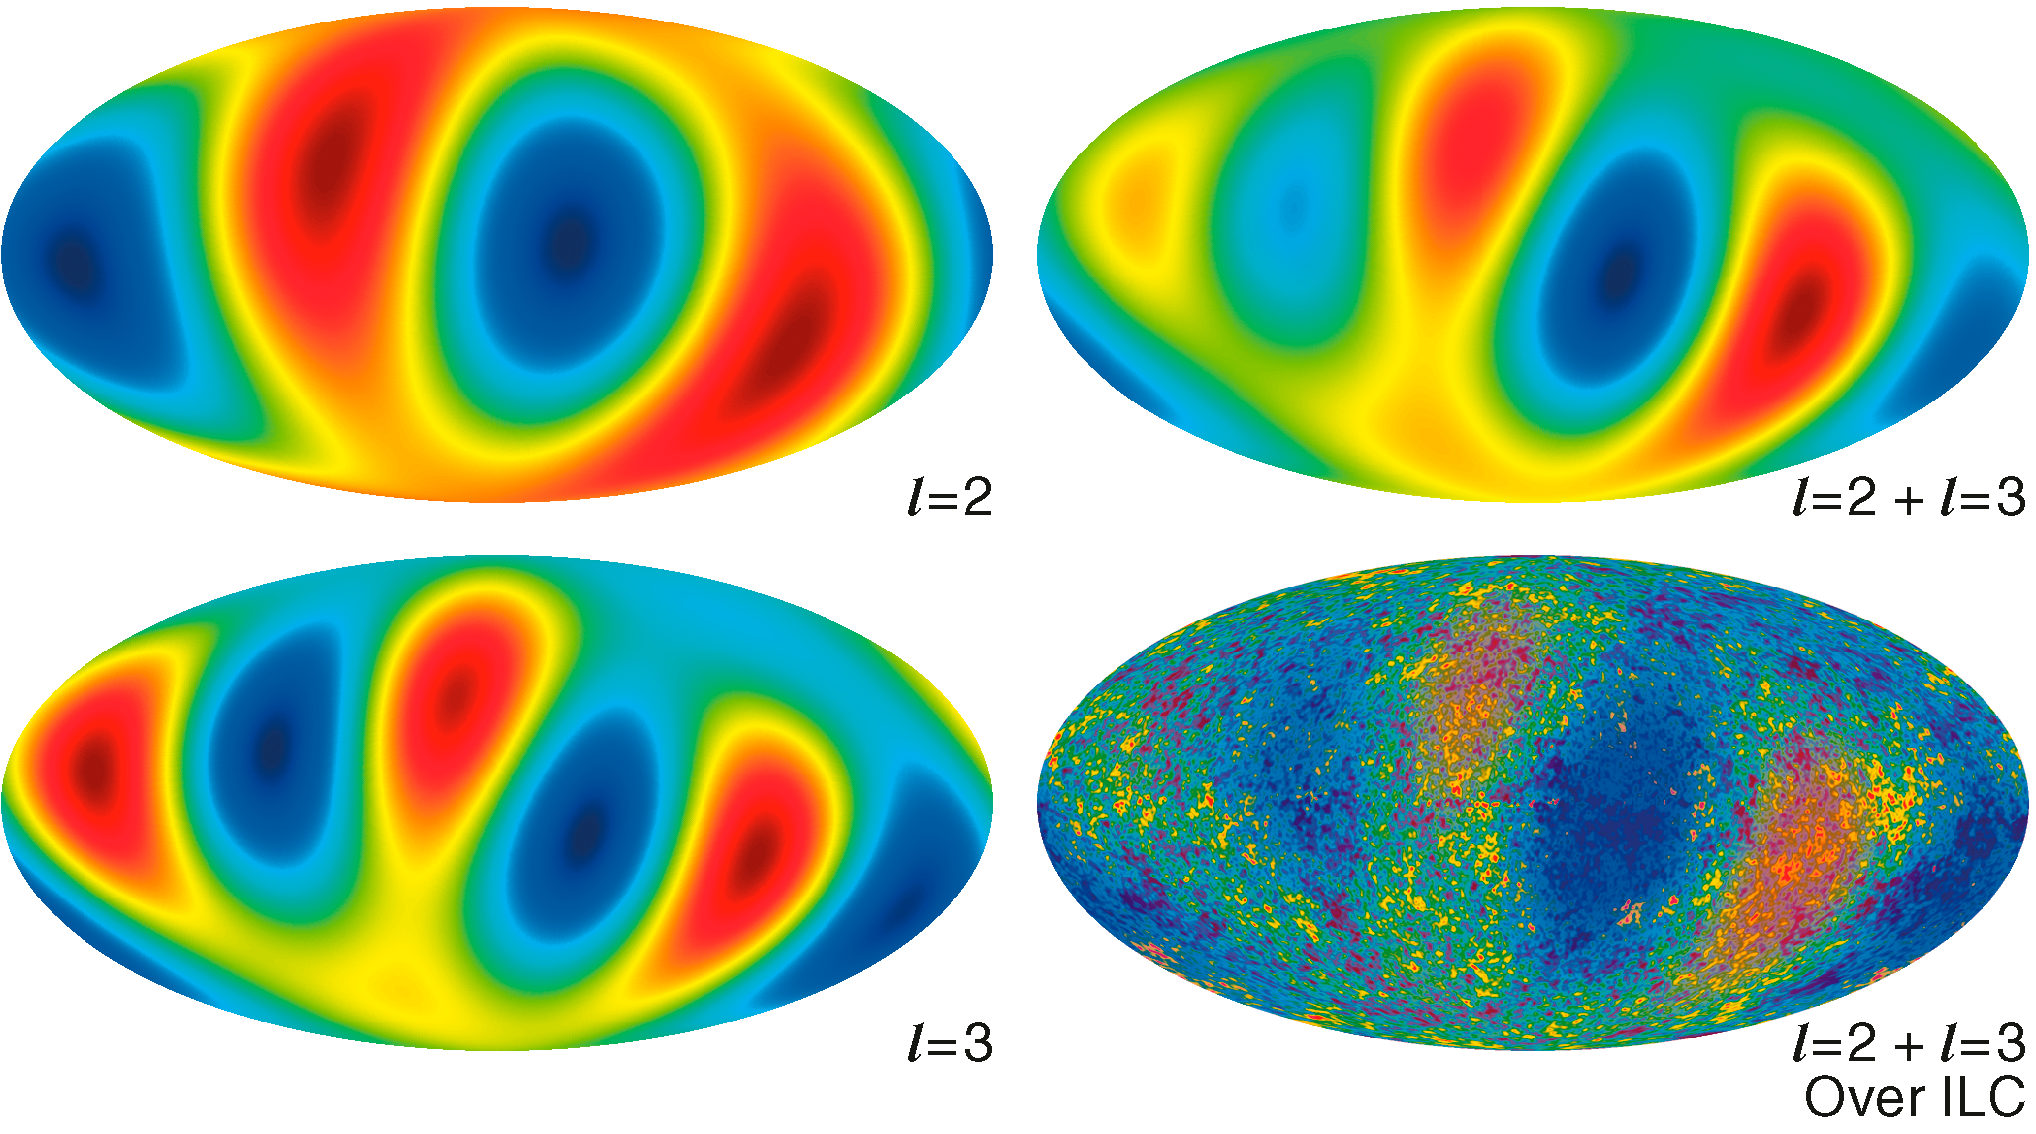
The cosmic microwave background is supposed to be directionless in the statistical sense. Its tiny temperature variations should form a random pattern with no preferred cosmic north, no privileged plane and no line pointing back towards Earth. Yet two of the largest patterns in the oldest light, known as the quadrupole and octopole, appear unusually aligned with one another. Stranger still, their shared geometry lies close to directions defined by the Solar System.
The feature has carried an irresistible nickname for two decades: the “axis of evil.” It is a real pattern in the maps, not an internet invention. It also remains an anomaly rather than a discovery that the universe has an axis. Its significance changes with the statistic, map and foreground treatment used, while the fact that researchers noticed the relationship after examining the data complicates every apparently tiny probability attached to it.
Turning the infant universe into a map
The cosmic microwave background, or CMB, was released when the universe was about 380,000 years old. Before that time, matter formed a hot plasma that scattered light repeatedly. Once the cosmos cooled enough for electrons and nuclei to combine into neutral atoms, photons could travel freely. Expansion has since stretched that radiation into microwaves with an average temperature of about 2.7 kelvin.
NASA’s Wilkinson Microwave Anisotropy Probe, WMAP, and the European Space Agency’s Planck observatory measured differences in that temperature across the entire sky. The variations are only tens to hundreds of millionths of a degree, but they preserve information about the density fluctuations that eventually grew into galaxies. NASA’s WMAP mission overview explains how nine years of observations produced a foreground-cleaned full-sky map of this ancient radiation.
Cosmologists describe the map by decomposing it into spherical harmonics, the spherical equivalent of separating a musical sound into notes. Each harmonic is labelled by a multipole number, written as ℓ. Small values describe the broadest structures on the sky. The dipole, ℓ = 1, divides the sky into one hotter and one colder side and is dominated by the Solar System’s motion relative to the CMB. The quadrupole, ℓ = 2, has a four-lobed structure. The octopole, ℓ = 3, breaks the sky into a still more complex pattern.
Under the standard cosmological model, the quadrupole and octopole arise from random primordial fluctuations. Their orientations should therefore be unrelated. There is no reason for their preferred planes to line up with one another, and still less reason for either to know about the ecliptic, the plane of Earth’s orbit around the Sun.
The two largest primordial patterns lean together
When researchers isolated the lowest multipoles in early WMAP maps, they found that the quadrupole and octopole were unusually planar and their preferred directions were close. Different mathematical definitions give somewhat different angles, but the alignment repeatedly appeared across cleaned maps. A WMAP seven-year analysis found the two components aligned to within roughly one degree in one full-sky map, while stressing that the result depended on how the foreground-cleaned sky was reconstructed.
The connection to the Solar System is more complicated than saying that one cosmic line simply lies along Earth’s orbit. The planes and normals constructed from the quadrupole and octopole show relationships with the ecliptic plane, the directions of the equinoxes and the CMB dipole produced by our motion. In some visualisations, the ecliptic separates unusually strong structure in one region from weaker structure in the opposite hemisphere.
That combination is what made the anomaly unsettling. The CMB originated billions of years before the Sun formed. A primordial cosmic pattern should not be arranged around a coordinate system created by one young planetary system. If the relationship were physical, it could challenge statistical isotropy, the assumption that the universe has the same large-scale properties in every direction.
The nickname came from João Magueijo and Kate Land, who used “axis of evil” in 2005 to emphasise how awkward such a preferred direction would be for standard cosmology. It was memorable, but it can also mislead. There is no single universally agreed axis extracted by one unique procedure. There is a family of related low-multipole alignments measured with several statistics.
Where the 0.3 per cent figure comes from
Published estimates of the chance probability vary. Some tests of the mutual quadrupole-octopole alignment produce values around one or two per cent. Tests combining that alignment with selected Solar System directions can produce much smaller values. A detailed comparison of WMAP and Planck maps reported greater-than-three-sigma results for both the mutual alignment and its relationship to the CMB dipole across the Planck maps it examined. Three sigma is often translated into a chance rate below about 0.3 per cent, depending on whether a one-sided or two-sided convention is used.
That number is not the probability that the universe has no preferred direction. It is the fraction of simulated isotropic skies that look at least as unusual under a particular statistic chosen by the researchers. Change the definition of alignment, the Galactic mask, the method used to remove foreground emission or the reference directions being tested, and the number changes.
There is a deeper statistical trap. The quadrupole and octopole were not necessarily selected for this exact test before anyone saw the sky. Researchers examined a rich map for cold spots, hemispherical asymmetries, low power, parity effects and alignments with several familiar directions. If many patterns could have counted as surprising, the chance of finding at least one low p-value is greater than the quoted probability for the pattern eventually noticed.
The WMAP team illustrated this point with deliberate humour. Its anomalies paper drew the initials “S” and “H” through accidental hot and cold features and noted that the probability of that precise pattern would be vanishingly small if calculated after the fact. The team’s warning about a posteriori statistics was not that the quadrupole-octopole alignment is imaginary, but that an improbability calculated after choosing the most striking feature can exaggerate the evidence against the model.
Planck confirmed the pattern, but not a cosmic revolution
One hope was that WMAP’s alignment would vanish when a different spacecraft observed the sky with different instruments, frequencies and analysis methods. It did not simply disappear. Planck recovered related large-angle temperature anomalies, including low power, hemispherical asymmetry and low-multipole alignments. ESA’s account of the mission’s first cosmological map called the universe “simple but challenging” because the standard model fitted the data extremely well overall while subtle large-scale features remained.
Planck’s final statistical analysis was more cautious. The Planck 2018 isotropy and statistics paper tested the temperature and polarisation maps for many departures from the standard random, direction-independent picture. Several previously reported temperature anomalies persisted, but the collaboration concluded that the data provided no unambiguous evidence requiring a departure from the standard cosmological model.
Polarisation offers an important independent check. Temperature and polarisation were imprinted through related physics but have different noise and foreground problems. A truly primordial preferred direction might be expected to leave a corresponding signature in polarisation, although the prediction depends on the proposed model. ESA reported that the large-angle temperature anomalies were not detected at significant levels in Planck’s large-scale polarisation data. The measurements were also less sensitive than the temperature map at those enormous angular scales, so this was not a definitive disproof.
Possible explanations all have difficulties
The least exotic explanation is chance. We observe only one CMB sky, not an ensemble of universes, and the lowest multipoles contain very few independent modes. This unavoidable “cosmic variance” makes the largest scales intrinsically difficult to judge. An unlikely configuration has to occur in the one realisation we can see, and a few unusual statistics do not automatically overturn a model that explains thousands of other measurements.
Foreground contamination is another possibility. Producing a CMB map requires subtracting microwave emission from Galactic dust, synchrotron radiation and other sources. Residual foregrounds can affect the broadest patterns most strongly. Yet the persistence of the alignment across WMAP and Planck maps, frequencies and cleaning methods makes a simple single-instrument error less satisfying.
A local Solar System signal would naturally explain why the ecliptic appears, but no accepted foreground model has reproduced the whole anomaly at the required amplitude and frequency behaviour. Proposed sources have included interplanetary dust emission, calibration effects linked to observing strategy and imperfect removal of our motion-induced signal.
The most dramatic options invoke new cosmology: a non-trivial global shape for space, anisotropic expansion, primordial magnetic fields or unusual physics during inflation. These ideas can create preferred directions, but they must also preserve the standard model’s remarkable success across the rest of the CMB spectrum and other observations. None has emerged as a compelling explanation of the complete set of alignments.
An anomaly is a question, not an answer
The “axis of evil” survives because it occupies an uncomfortable middle ground. It is visible in independent temperature maps and can look highly improbable under carefully defined tests. At the same time, its statistical strength is sensitive to choices made after seeing the sky, and polarisation has not supplied the clean independent confirmation that would turn curiosity into a discovery.
Future CMB polarisation surveys can test the largest scales with better control of foregrounds and systematics. If the temperature alignment came from the primordial universe, a related polarisation pattern could sharpen the case. If it arose from local contamination or map-making, improved frequency coverage may expose that source. If neither happens, the alignment may remain an irreducible accident written into the only microwave sky humanity can observe.
The oldest light does contain two enormous patterns that lean together and point uncomfortably close to the geometry of our cosmic neighbourhood. What it does not yet contain is a verdict. The anomaly may be new physics, local interference, a statistical fluke or a lesson about how easily a sufficiently rich map can surprise the people studying it.