

The upper 2,000 metres of the ocean held more heat in 2025 than in any earlier year in the modern instrumental record. In the annual international assessment behind that conclusion, the Institute of Atmospheric Physics at the Chinese Academy of Sciences estimated a gain of 23 plus or minus 8 zettajoules relative to 2024.
The central figure is difficult to picture. A zettajoule is 1021 joules, so 23 zettajoules is 23 billion trillion joules. Using the latest global primary-energy statistics then available, Carbon Brief calculated that the increase was around 39 times the energy produced by all human activities in 2023.
That comparison translates scale. It does not mean humanity generated the heat that accumulated in the ocean, and it does not compare like-for-like physical processes. The more important result is the run behind the number: 2025 was the ninth consecutive year in which annual ocean heat content set a record, the longest unbroken sequence in the observational series.
What the 23-zettajoule estimate represents
The peer-reviewed assessment in Advances in Atmospheric Sciences was led by Yuying Pan and Lijing Cheng and involved researchers from institutions across several continents. It measured ocean heat content rather than the temperature at a single depth or location.
Ocean heat content estimates the thermal energy stored across a volume of water. Researchers derive it from temperature profiles, taking account of seawater’s density and its capacity to hold heat. The quoted figure covers the layer from the surface to 2,000 metres. It is a change from 2024 to 2025, not the total heat already stored in the ocean.
It also does not directly include water below 2,000 metres. The abyssal ocean stores heat too, but it is observed much less completely. Even within the upper layer, no instrument can sample every place at every moment. The uncertainty attached to the estimate is therefore part of the result, not a footnote to be discarded.
How a planet-sized thermometer is assembled
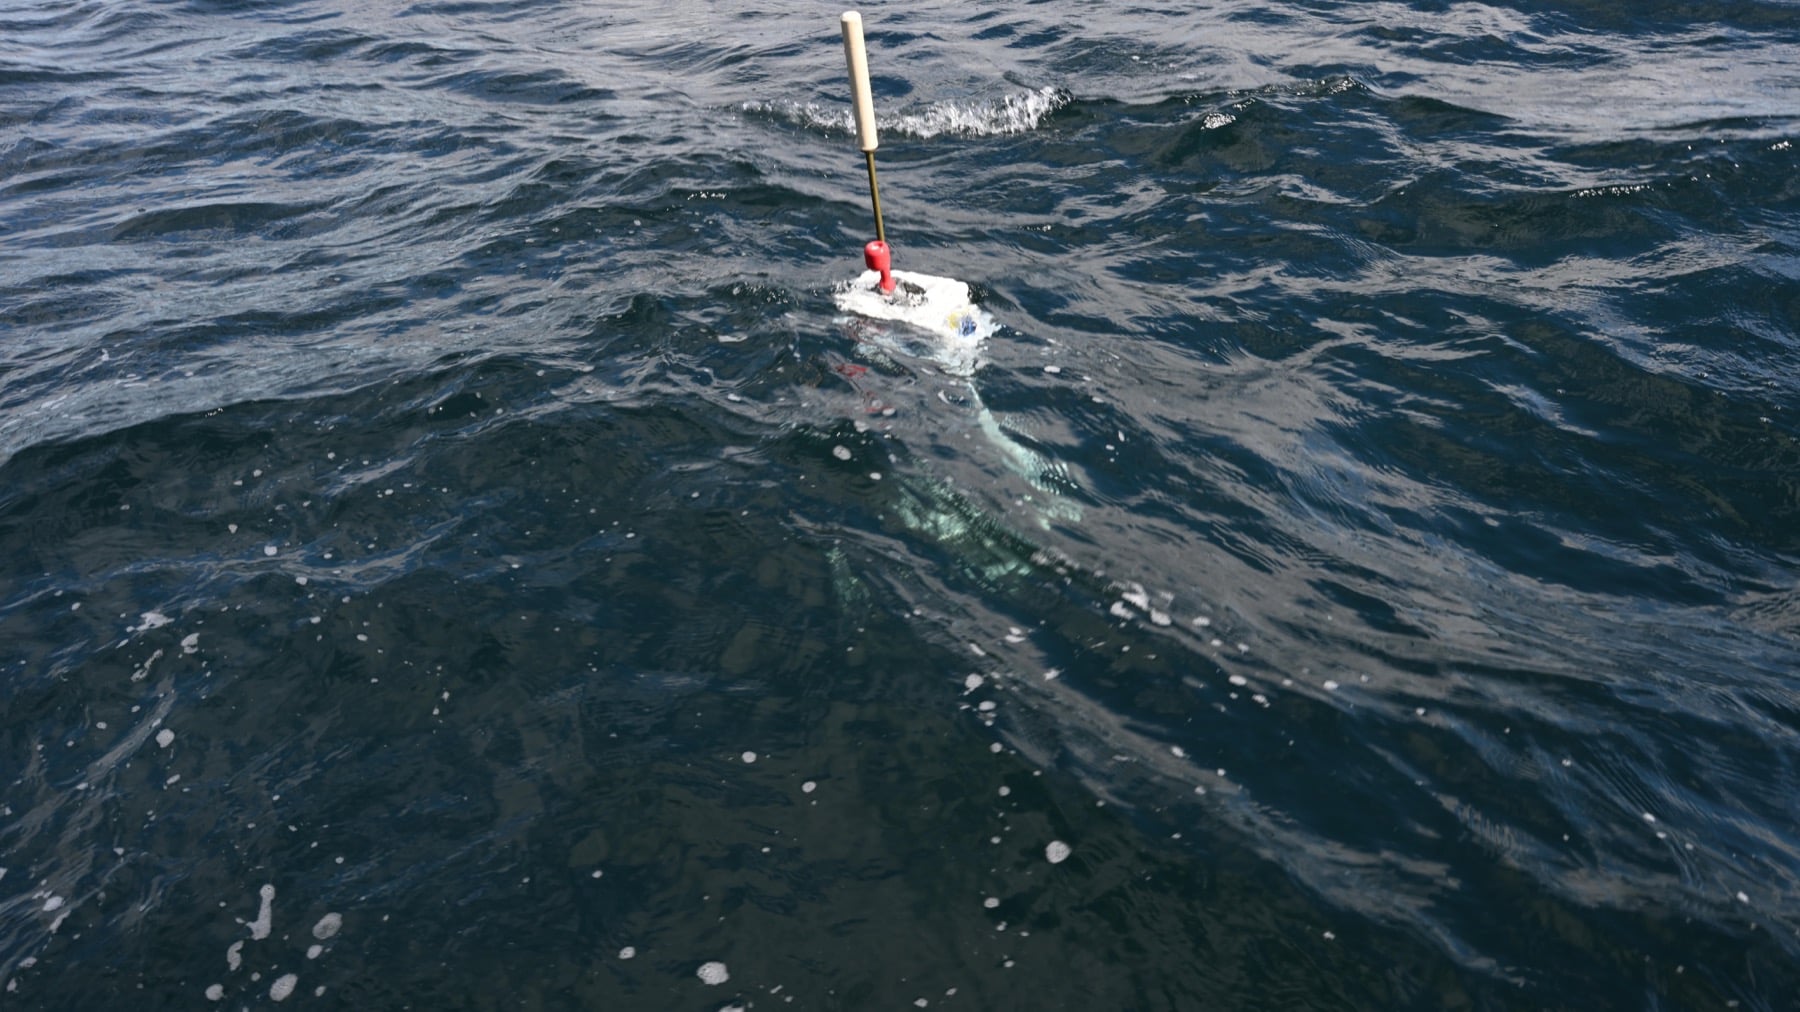
There is no literal thermometer for the whole ocean. Modern estimates depend heavily on the international Argo programme, whose robotic floats descend to about two kilometres and then rise while measuring temperature and salinity. Data from ships, moorings and other instruments are also used, especially when researchers extend the record into the decades before Argo became global.
Each profile is only a thin vertical path through an immense and moving body of water. Scientists have to correct known biases in older instruments, perform quality checks and estimate conditions across gaps in space and time. Different research groups make some of those choices differently, which is one reason annual figures do not match exactly.
Argo has changed what can be known. Its broad coverage since the early 2000s has reduced uncertainty and made it possible to follow heat as it shifts between basins and depths. Yet the older end of a record beginning in the late 1950s remains less densely sampled than its modern end.
Four datasets agreed on the record, not the exact increment
The 23 plus or minus 8 zettajoules in the headline is the IAP/CAS estimate. The paper also assessed three independent products. Italy’s CIGAR-RT reanalysis estimated a 20 plus or minus 3 zettajoule increase. NOAA’s NCEI product gave 13 plus or minus 5 zettajoules, although the version used then contained 2025 observations only through June.
Copernicus Marine produced a much larger estimate of 70 plus or minus 39 zettajoules. The authors cautioned that its near-real-time inputs created substantial uncertainty. Those values are not four interchangeable readings from identical instruments.
They do, however, share the finding that matters most. All placed 2025 upper-ocean heat content above 2024. Copernicus has since independently reported that every assessed layer down to 2,000 metres reached its highest level on record in 2025.
So 23 zettajoules should be read as a well-supported central estimate from one major analysis, not as a quantity known to the last joule. The record direction is more robust than the precise size of this one-year step.
Why the 39-times comparison can also appear as 37
Twenty-three zettajoules equals 23,000 exajoules. Carbon Brief compared it with a 2023 global primary-energy total of about 590 exajoules and rounded the ratio to 39. A Chinese Academy of Sciences summary used about 620 exajoules for the same year and described the increase as roughly 37 years of primary-energy consumption.
The difference comes from the chosen energy dataset and the accounting conventions behind it. It is not a disagreement about ocean physics. “Roughly 39 times” is a defensible rendering of the Carbon Brief calculation, while “roughly 37 times” is defensible with the Energy Institute benchmark.
Primary energy is also much broader than electricity. It counts energy sources used for transport, heating, industry and other purposes before or during conversion. Comparing 23 zettajoules only with annual electricity generation would produce a far larger ratio and answer a different question.
Most importantly, the arithmetic is not a causal claim. The ocean did not absorb humanity’s power output. Human greenhouse-gas emissions alter the balance between incoming and outgoing radiation, leaving extra solar-derived energy in the Earth system. The energy-use comparison merely supplies a familiar ruler.
The surface cooled slightly while the reservoir grew
Global mean sea-surface temperature in 2025 was 0.12 plus or minus 0.03 degrees Celsius lower than in 2024 in the IAP/CAS analysis. It nevertheless remained 0.49 degrees above the 1981 to 2010 baseline and ranked as the third warmest annual sea surface in the instrumental record.
There is no contradiction between that slight decline and record ocean heat content. Sea-surface temperature describes a thin, responsive boundary between water and air. Winds, evaporation and natural patterns such as El Niño and La Niña can change it relatively quickly. Ocean heat content integrates temperature changes through two kilometres of water. It measures the reservoir, not merely its skin.
Conditions evolved towards La Niña during 2025, rearranging winds and currents across the tropical Pacific. The surface could step down from 2024’s exceptional peak while the much larger body of water beneath it continued to gain heat.
The new high was broad, but not uniform
The paper found that about 33 per cent of the global ocean area ranked among its three warmest years in the 1958 to 2025 record. Roughly 57 per cent ranked in the top five. Particularly warm areas included the tropical and South Atlantic, the Mediterranean Sea, the North Indian Ocean and parts of the Southern Ocean.
A global total does not mean every basin warmed during the year or that every location changed by the same amount. Currents move heat horizontally. Winds can push it downwards or draw deeper water towards the surface. Regional gains and losses sit inside the planetary sum.
The longer pattern is harder to explain as redistribution alone. The World Meteorological Organization’s 2025 climate report also placed upper-2,000-metre heat content at a record in its 66-year record and found that the warming rate over 2005 to 2025 was more than twice the rate over 1960 to 2005.
Why nine consecutive records matter
One annual record can reflect an unusual circulation pattern or the uncertainty in a year-to-year estimate. Nine in succession are more revealing. Each year since 2017 has moved the annual maximum higher in the series, even while surface conditions and regional patterns have varied.
That does not mean each annual increase was identical or that another record is guaranteed every calendar year. Heat can move below 2,000 metres, and natural variability can create pauses or reversals in the measured upper layer. It means the background accumulation has so far been strong enough to keep lifting the annual total.
This record also provides a useful companion to the contested question SpaceDaily examined in an earlier article: whether the pace of human-driven surface warming is accelerating. Ocean heat content is a different indicator. It changes more slowly and captures energy stored beneath the surface, giving scientists another way to assess Earth’s energy imbalance.
Heat out of sight still has consequences
The ocean takes up close to 90 per cent of the excess heat accumulating in the climate system. That enormous capacity has limited how rapidly the atmosphere warms, but it does not make the energy harmless or permanent.
Warm seawater expands, contributing to sea-level rise even before meltwater from glaciers and ice sheets is counted. Stored energy can help sustain marine heatwaves, increase stress on ecosystems and, when warm water is available near the surface, provide additional heat and moisture to the atmosphere.
A global annual number cannot attribute an individual cyclone, flood or coral-bleaching event. Local conditions and formal attribution studies still matter. The record instead describes the background reservoir in which those events occur.
The ocean also gives the climate system a long memory. Heat mixed into deeper water can remain there for decades or centuries before returning to the surface or being carried elsewhere. Much of the 2025 record was invisible from a beach, yet it will not simply vanish when the calendar changes.
The most careful conclusion is narrower than the most dramatic comparison and stronger than a single number. Twenty-three zettajoules is one analysis’s estimate, with an eight-zettajoule uncertainty. Thirty-nine times annual human energy use is a rounded translation based on one accounting series. The ninth consecutive record, supported across multiple ocean datasets, is the durable finding.