

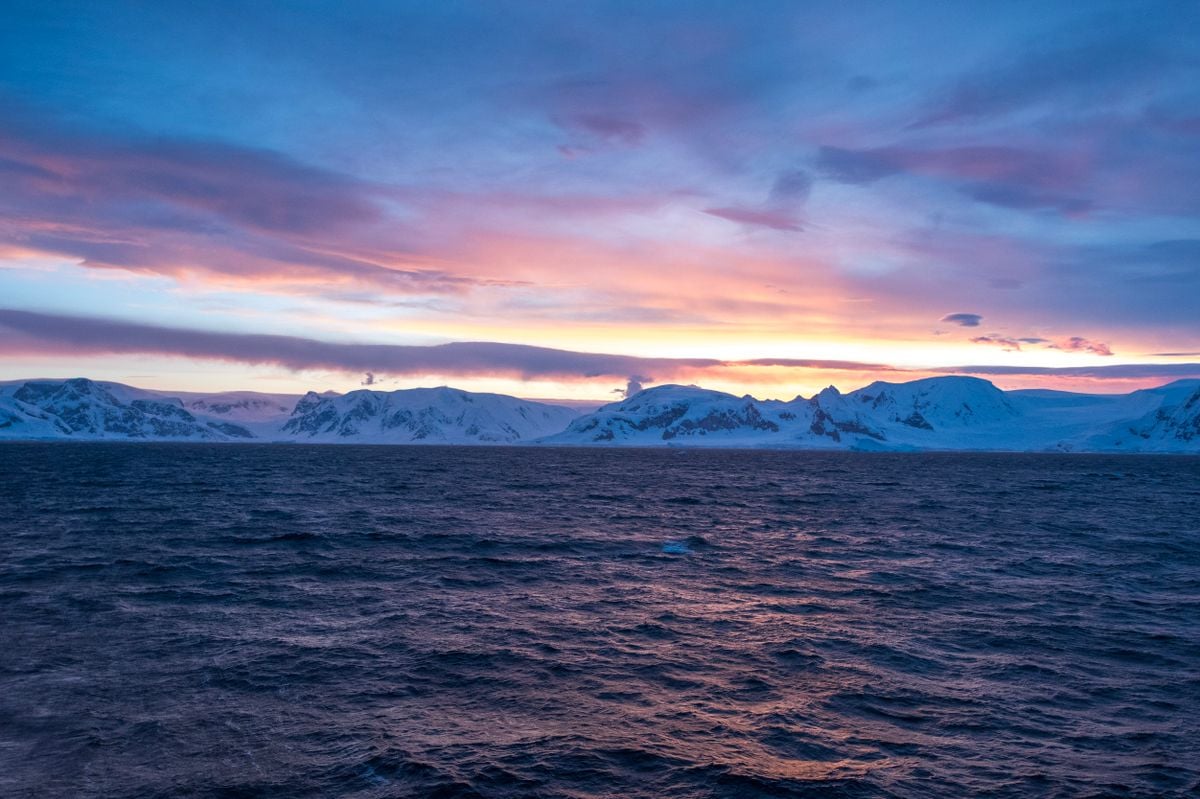
Antarctica’s ice sheet gained about 695 billion tonnes of mass between July 2021 and April 2023, the largest increase over a 22-month interval in the roughly two-decade satellite-gravity record examined by a new study. The extra mass came during an exceptional snowfall episode in East Antarctica, large enough to outweigh losses elsewhere on the continent over that period.
A study published in Nature on August 19, 2026 connects the episode to persistent warmth in the tropical western Pacific and eastern Indian Ocean. Its explanation links distant ocean temperatures, atmospheric circulation and the delivery of moisture to Antarctic snowfields.
The gain was real, but its duration matters.
A tropical trigger with a polar consequence
The researchers combined observations with model experiments to investigate the tropical warm pool, a broad region of unusually warm ocean water. They found that its sustained warming excited a poleward-propagating Rossby-wave train, a sequence of large-scale atmospheric disturbances that altered circulation far to the south.
The resulting pressure pattern favoured additional precipitation over Queen Mary Land and Wilkes Land in East Antarctica. Crucially, the water supplying that snowfall came mainly from the mid-latitude Indian Ocean. The tropical warm pool helped organise the atmospheric conditions that directed moisture towards the ice sheet; it was not simply a distant reservoir whose water travelled directly to Antarctica.
This distinction separates the trigger from the moisture source. A change in one region can reorganise winds elsewhere, altering where existing atmospheric moisture eventually falls. The amount of snowfall at the destination depends on that circulation as well as on how much water vapour the air contains.
How satellites weigh an ice sheet
The mass estimate comes from satellite gravimetry. NASA’s GRACE mission, followed by GRACE Follow-On, measures changes in Earth’s gravitational field. As the amount and distribution of mass change below the satellites, the gravitational pull acting on them changes too.
NASA’s explanation of the technique describes how scientists separate the changing ice signal from other contributions to gravity, including the underlying solid Earth. The resulting records allow researchers to follow gains and losses across large ice sheets rather than infer mass solely from photographs of their edges.
A gigatonne is one billion metric tonnes. In this case, the 695-gigatonne figure is the net change in ice-sheet mass over the stated interval. It is not a measurement of snowfall alone: snowfall adds mass, while ice flow and other processes remove it. The satellite total records the balance of those competing contributions.
That is also why a photograph cannot establish the result. A snowy landscape, a retreating glacier front and a continent-wide mass estimate each describe different aspects of Antarctica. Gravity measurements give the broad accounting needed to determine whether the total increased or decreased.
Why a snowy interval does not establish a new trend
The University of Washington’s account of the research stresses that ice loss continued in West Antarctica while excess snow accumulated in the east. Researchers used computational moisture tracing to investigate the origin of the precipitation and whether the conditions responsible were likely to persist.
Co-author Eric Steig and colleagues interpret the episode primarily as climate variability. Historical records show that the tropical warm pool can remain unusually warm for several years before conditions change. Separating human influence from natural tropical variability is difficult, so this event does not by itself establish a lasting new Antarctic snowfall regime.
Warmer air can carry more moisture, making increased polar snowfall physically plausible in a warming climate. But that general expectation does not explain every individual event. Here, the researchers identified a particular sequence of ocean and atmospheric conditions that helped produce an unusually large accumulation.
A short-term gain and a long-term decline can both be true.
Land ice, sea ice and the longer record
The finding concerns the Antarctic Ice Sheet, the enormous store of frozen water on land. It should not be confused with sea-ice extent, which measures the area of ocean covered by floating ice. Those records respond to different processes and cannot be substituted for one another.
NASA’s ice-sheet indicator reports that Antarctica lost an average of about 135 billion tonnes a year from 2002 through 2025. That longer period includes years of gains as well as losses. The 2021–2023 increase is a substantial upward movement within the record, not evidence that all earlier losses were restored.
Comparing a 22-month total with a multi-decade annual average requires care. They describe different time windows and answer different questions. The short interval reveals the strength of an exceptional event; the longer record shows the overall direction across many such fluctuations.
A better explanation improves future estimates
The Chinese Academy of Sciences’ summary describes the event as a temporary reversal linked to multiyear tropical warming. Understanding that connection helps researchers interpret future changes without assuming that Antarctica responds only to conditions immediately around its coastline.
For sea-level projections, the balance between snowfall and the removal of land ice is essential. A model needs to represent how ocean conditions affect glaciers, but also how distant circulation patterns deliver snow. Either side of that balance can change the total recorded from space.
The exceptional 695-billion-tonne gain therefore adds a mechanism to the explanation of Antarctic variability. It shows how conditions thousands of kilometres away can temporarily alter the continent’s mass balance, while the longer satellite record remains necessary to judge the direction of change.