
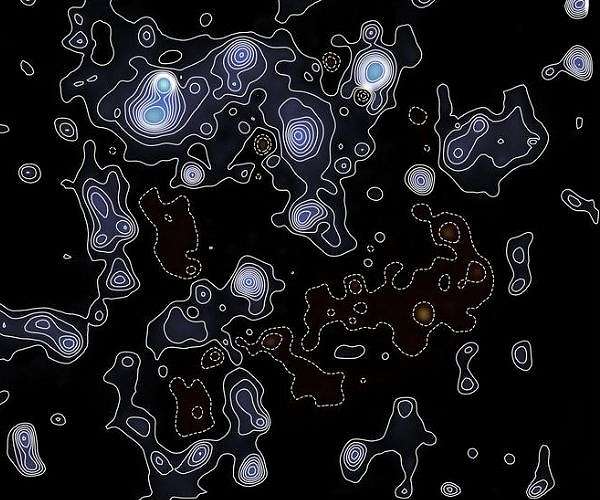
The blue web spread across Webb’s new COSMOS image is not a photograph of dark matter.
No telescope has seen a dark-matter particle, and the colour is an overlay rather than light emitted by the invisible material. What Webb recorded were galaxies, almost 800,000 of them. The dark-matter map was reconstructed afterward from the minute, coordinated distortions that mass between those galaxies and Earth left on their apparent shapes.
That distinction does not make the achievement less impressive. It explains why the achievement required so many galaxies.
The James Webb Space Telescope resolved usable shapes at a density of 129 galaxies per square arcminute across the COSMOS-Web footprint. Multiplied across the mapped area, that is roughly a quarter-million background markers. Their combined gravitational signal produced a projected mass map with an angular resolution of 1.00 plus or minus 0.01 arcminutes, more than twice as sharp as the earlier Hubble reconstruction of the same field.
Clusters that had blurred together became better confined. New clumps appeared. Thin, low-density connections emerged between the brighter concentrations of galaxies. Empty-looking regions could be measured as underdensities rather than treated simply as blank sky.
The result, published in Nature Astronomy, is best understood not as the first sight of an invisible substance but as the sharpest wide-area reading yet of its gravitational handwriting.
Dark matter becomes visible through what it does to light
Dark matter earns its name by refusing the ordinary methods of astronomy. It does not emit, reflect or absorb light in any detectable way. A dark cloud of dust can hide a star, but dark matter would not even make that kind of silhouette. It seems to pass through ordinary matter and through itself with little or no interaction beyond gravity.
Its gravity is hard to miss. Stars orbit within galaxies too quickly for the visible material alone to hold them. Galaxies move within clusters as though surrounded by far more mass than telescopes can count. The early universe grew into the modern network of galaxies in a way that requires substantially more gravitating matter than the atoms in stars, gas, planets and people can provide.
As Space Daily explored in its account of the 95 per cent of the cosmos labelled dark, ordinary matter represents only about five per cent of the universe’s total energy budget. Dark matter accounts for roughly 27 per cent, while dark energy supplies most of the rest. Considering matter alone, the ordinary kind makes up only about one sixth.
Weak gravitational lensing measures that hidden mass without requiring it to glow. General relativity says mass curves spacetime. Light from a distant galaxy follows that curved geometry, so an intervening concentration of matter can slightly stretch or rotate the galaxy’s apparent image.
The effect in this survey is usually weak. There are no giant, unmistakable arcs around every mass concentration. Each source galaxy also began with its own shape and orientation, so one elongated image proves almost nothing. Across a large population, however, the original orientations are approximately random while lensing imposes a faint, coherent alignment called shear. Average enough galaxy shapes and much of the random variation cancels, allowing the gravitational pattern to remain.
The 800,000 galaxies and the 250,000 galaxies do different jobs
Two galaxy counts appear in descriptions of the project, and they are not contradictory.
Webb identified nearly 800,000 galaxies in the image after spending about 255 hours on the COSMOS region. That is the population visible in the field. The lensing reconstruction used the smaller population for which the team could obtain reliable shape measurements in the necessary data.
The paper reports 129 shape measurements per square arcminute over a roughly 0.54-square-degree Webb footprint. A square degree contains 3,600 square arcminutes, so that density corresponds to about 250,000 usable galaxy shapes across the area. The number is approximate because the survey boundary, masks and independently measured filter samples make the real catalogue more complicated than a clean rectangle.
The researchers relied principally on NIRCam’s F115W and F150W filters, centred at wavelengths of about 1.1 and 1.5 micrometres. Many galaxy shapes were measured independently in both. Webb’s near-infrared sensitivity also resolves distant sources whose visible light has been shifted to longer wavelengths by cosmic expansion.
This high source density is the key to resolution. A weak-lensing map has to average enough background galaxies for the shear to rise above what astronomers call shape noise, the overwhelming variation in the galaxies’ natural forms. If only a few usable galaxies occupy each square arcminute, the reconstruction must smooth across a larger area. If there are 129, the smoothing window can shrink.
Leading ground-based surveys typically resolve the shapes of roughly 7 to 19 galaxies per square arcminute because Earth’s atmosphere blurs the images. Hubble, above the atmosphere, achieved about 71 in the earlier COSMOS work. Webb nearly doubled that density and reached galaxies at greater distances.
More than twice Hubble’s resolution needs a careful definition
The new map covers a field approximately 0.77 degrees by 0.70 degrees when the surrounding Hubble information used in the reconstruction is included. NASA describes the region as about 2.5 times the apparent area of the full Moon. It lies in Sextans, close to the celestial equator, where telescopes in both hemispheres can observe it.
The field is wide by the standards of imaging this deep, but microscopic beside the whole sky. Its value comes from both dimensions: enough area to contain clusters, filaments and relatively empty regions, and enough depth to pack the background with faint galaxies.
The comparison with Hubble is also methodological. Using the same broad reconstruction framework, the earlier Hubble COSMOS map resolved the mass field at about 2.4 arcminutes. Webb reached 1.00 plus or minus 0.01 arcminutes. That makes the new mass map more than twice as sharp, even though Webb and Hubble can have similar image sharpness at selected wavelengths.
The phrase describes the resolution of this statistical weak-lensing map, not a universal claim that every Webb photograph is more than twice as sharp as every Hubble photograph.
That nuance matters because the map is not a conventional exposure. Researchers estimated shear, grouped it spatially and mathematically reconstructed a quantity called convergence, which describes the projected surface density of gravitating matter along each line of sight. The finished blue pattern traces both dark and ordinary matter. Dark matter dominates the matter budget, but stars, gas and dust are not subtracted particle by particle.
Why COSMOS was the right patch of sky
COSMOS stands for Cosmic Evolution Survey. For about two decades, it has served as a common field where major observatories can build layers of information at different wavelengths. Hubble supplied the landmark 2007 lensing map. Ground-based telescopes added spectroscopy and precise colours. X-ray observatories traced hot gas in galaxy groups and clusters. Radio and submillimetre instruments found active galaxies, dust and cold material.
The principle resembles the one behind Hubble’s famous deep fields: spend a large block of precious telescope time on a carefully chosen region, then let the density and diversity of the resulting data repay the investment for years. Space Daily’s history of the original 1995 Hubble Deep Field describes how an apparently empty patch became a census of roughly 3,000 galaxies. COSMOS trades some depth for a much wider, thoroughly cross-observed laboratory.
Webb’s COSMOS-Web programme extended that laboratory with four NIRCam filters. Mid-Infrared Instrument data and observations from other facilities helped refine photometric redshifts, estimates of distance based on how a galaxy’s brightness changes across wavelengths. Distance information matters because a lens can distort only objects behind it, and the strength of that distortion depends on the geometry between observer, lens and source.
The mass map is projected rather than a complete three-dimensional atlas. Structures at different distances can overlap on the same line of sight. Redshift information helps interpret them, but a blue peak should not automatically be imagined as one compact object at one exact distance.
The finer view separates clumps, filaments and uncertain peaks
The broad architecture resembles the standard cosmic web. Dense regions of projected mass coincide with groups and clusters of galaxies. Lower-density filaments bridge some of those knots. Underdense areas occupy the spaces between them.
This close alignment of dark-dominated mass with visible galaxies is expected. In the standard account of structure formation, dark matter began collapsing into clumps under gravity before ordinary gas could do so efficiently. Those gravitational wells drew in gas, establishing the environments where stars and galaxies later formed. Over billions of years the visible and invisible components evolved together, even though their small-scale behaviour differs.
The higher-resolution Webb reconstruction detected finer substructure and diffuse features that Hubble could not resolve in the same map. Some familiar mass concentrations now look smaller because their true extent is less blurred. That is not evidence that the structures physically contracted between the two observations. It is the astronomical equivalent of bringing an out-of-focus boundary into focus.
Several lensing peaks do not have obvious counterparts in the projected X-ray emission or the visible-galaxy density map. The NASA account of the research emphasises the newly visible clumps and filaments, while the paper keeps the ambiguous peaks open to several explanations.
A peak could mark an underluminous or dark-matter-dominated structure. It could be the combined signal of two smaller systems aligned by chance at different distances. It could sit at a redshift where the comparison catalogue is less sensitive. These possibilities make the peaks useful follow-up targets, not automatic discoveries of galaxies made entirely of dark matter.
A sharper distribution map does not reveal the particle
The map supports the gravitational role assigned to dark matter, but it does not identify what dark matter is.
Candidate explanations range from new particles beyond the Standard Model of particle physics to more complicated dark sectors. Alternatives modify gravity instead. Many can imitate one another on large scales, and a projected map of one field cannot settle the competition by itself.
What improved resolution can do is expose scales where theories begin to diverge. The simplest cold-dark-matter picture predicts a hierarchy of haloes and subhaloes, from enormous cluster structures down to masses far below what this map can reach. Particle interactions or warm dark matter could soften or erase some small structures. Ordinary astrophysical processes, including gas cooling, star formation and energy released by black holes, can also rearrange matter and complicate the comparison.
The present map establishes a benchmark rather than a verdict. It traces mass features toward redshift 2 and detects a particularly distant structure around redshift 1.1. Its strong sensitivity between redshifts 1 and 2 reaches “cosmic noon”, the era when the universe produced stars at its highest overall rate.
That creates a second scientific use. Instead of asking only where dark matter lies, astronomers can ask how a galaxy’s environment affected its growth when star formation was most intense. Future work could divide the sources into distance slices and reconstruct a more explicitly three-dimensional history of those environments. The current study points toward that tomography but does not claim to have completed it.
Webb supplies detail; Euclid and Roman will supply scale
A 0.54-square-degree Webb survey cannot reveal whether every filament and cluster in the wider universe behaves the same way. Cosmic variance, the fact that any small region may be unrepresentative, remains a limit.
The solution is not to make Webb map the entire sky. Its observing time is too valuable and its field of view too small. The solution is to combine facilities built for different jobs.
ESA’s Euclid mission is surveying a vast fraction of the extragalactic sky to study dark matter, dark energy and cosmic structure. NASA’s Nancy Grace Roman Space Telescope is designed to pair Hubble-like sharpness with a field of view about 100 times larger than Hubble’s. NASA says Roman’s eventual dark-matter mapping area will be roughly 4,400 times the COSMOS region, although it will not match Webb’s local spatial resolution.
That division of labour is powerful. Euclid and Roman can provide the statistics, locating rare structures and measuring patterns across enormous volumes. Webb can examine selected fields deeply enough to separate internal clumps and thin connections. COSMOS, observed repeatedly by many facilities, becomes a calibration ground where their methods overlap.
Space Daily’s earlier report on the Webb map captured its headline finding: dark and visible matter trace one another with far greater detail than before. The deeper lesson is how that finding was extracted. Nearly 800,000 galaxies fill the image, roughly 250,000 usable shapes carry the lensing reconstruction, and none of those galaxies is merely a decorative point of light.
Each is a distorted gauge behind an invisible foreground.
Webb has not made dark matter luminous. It has made the gravitational pattern harder to blur.