

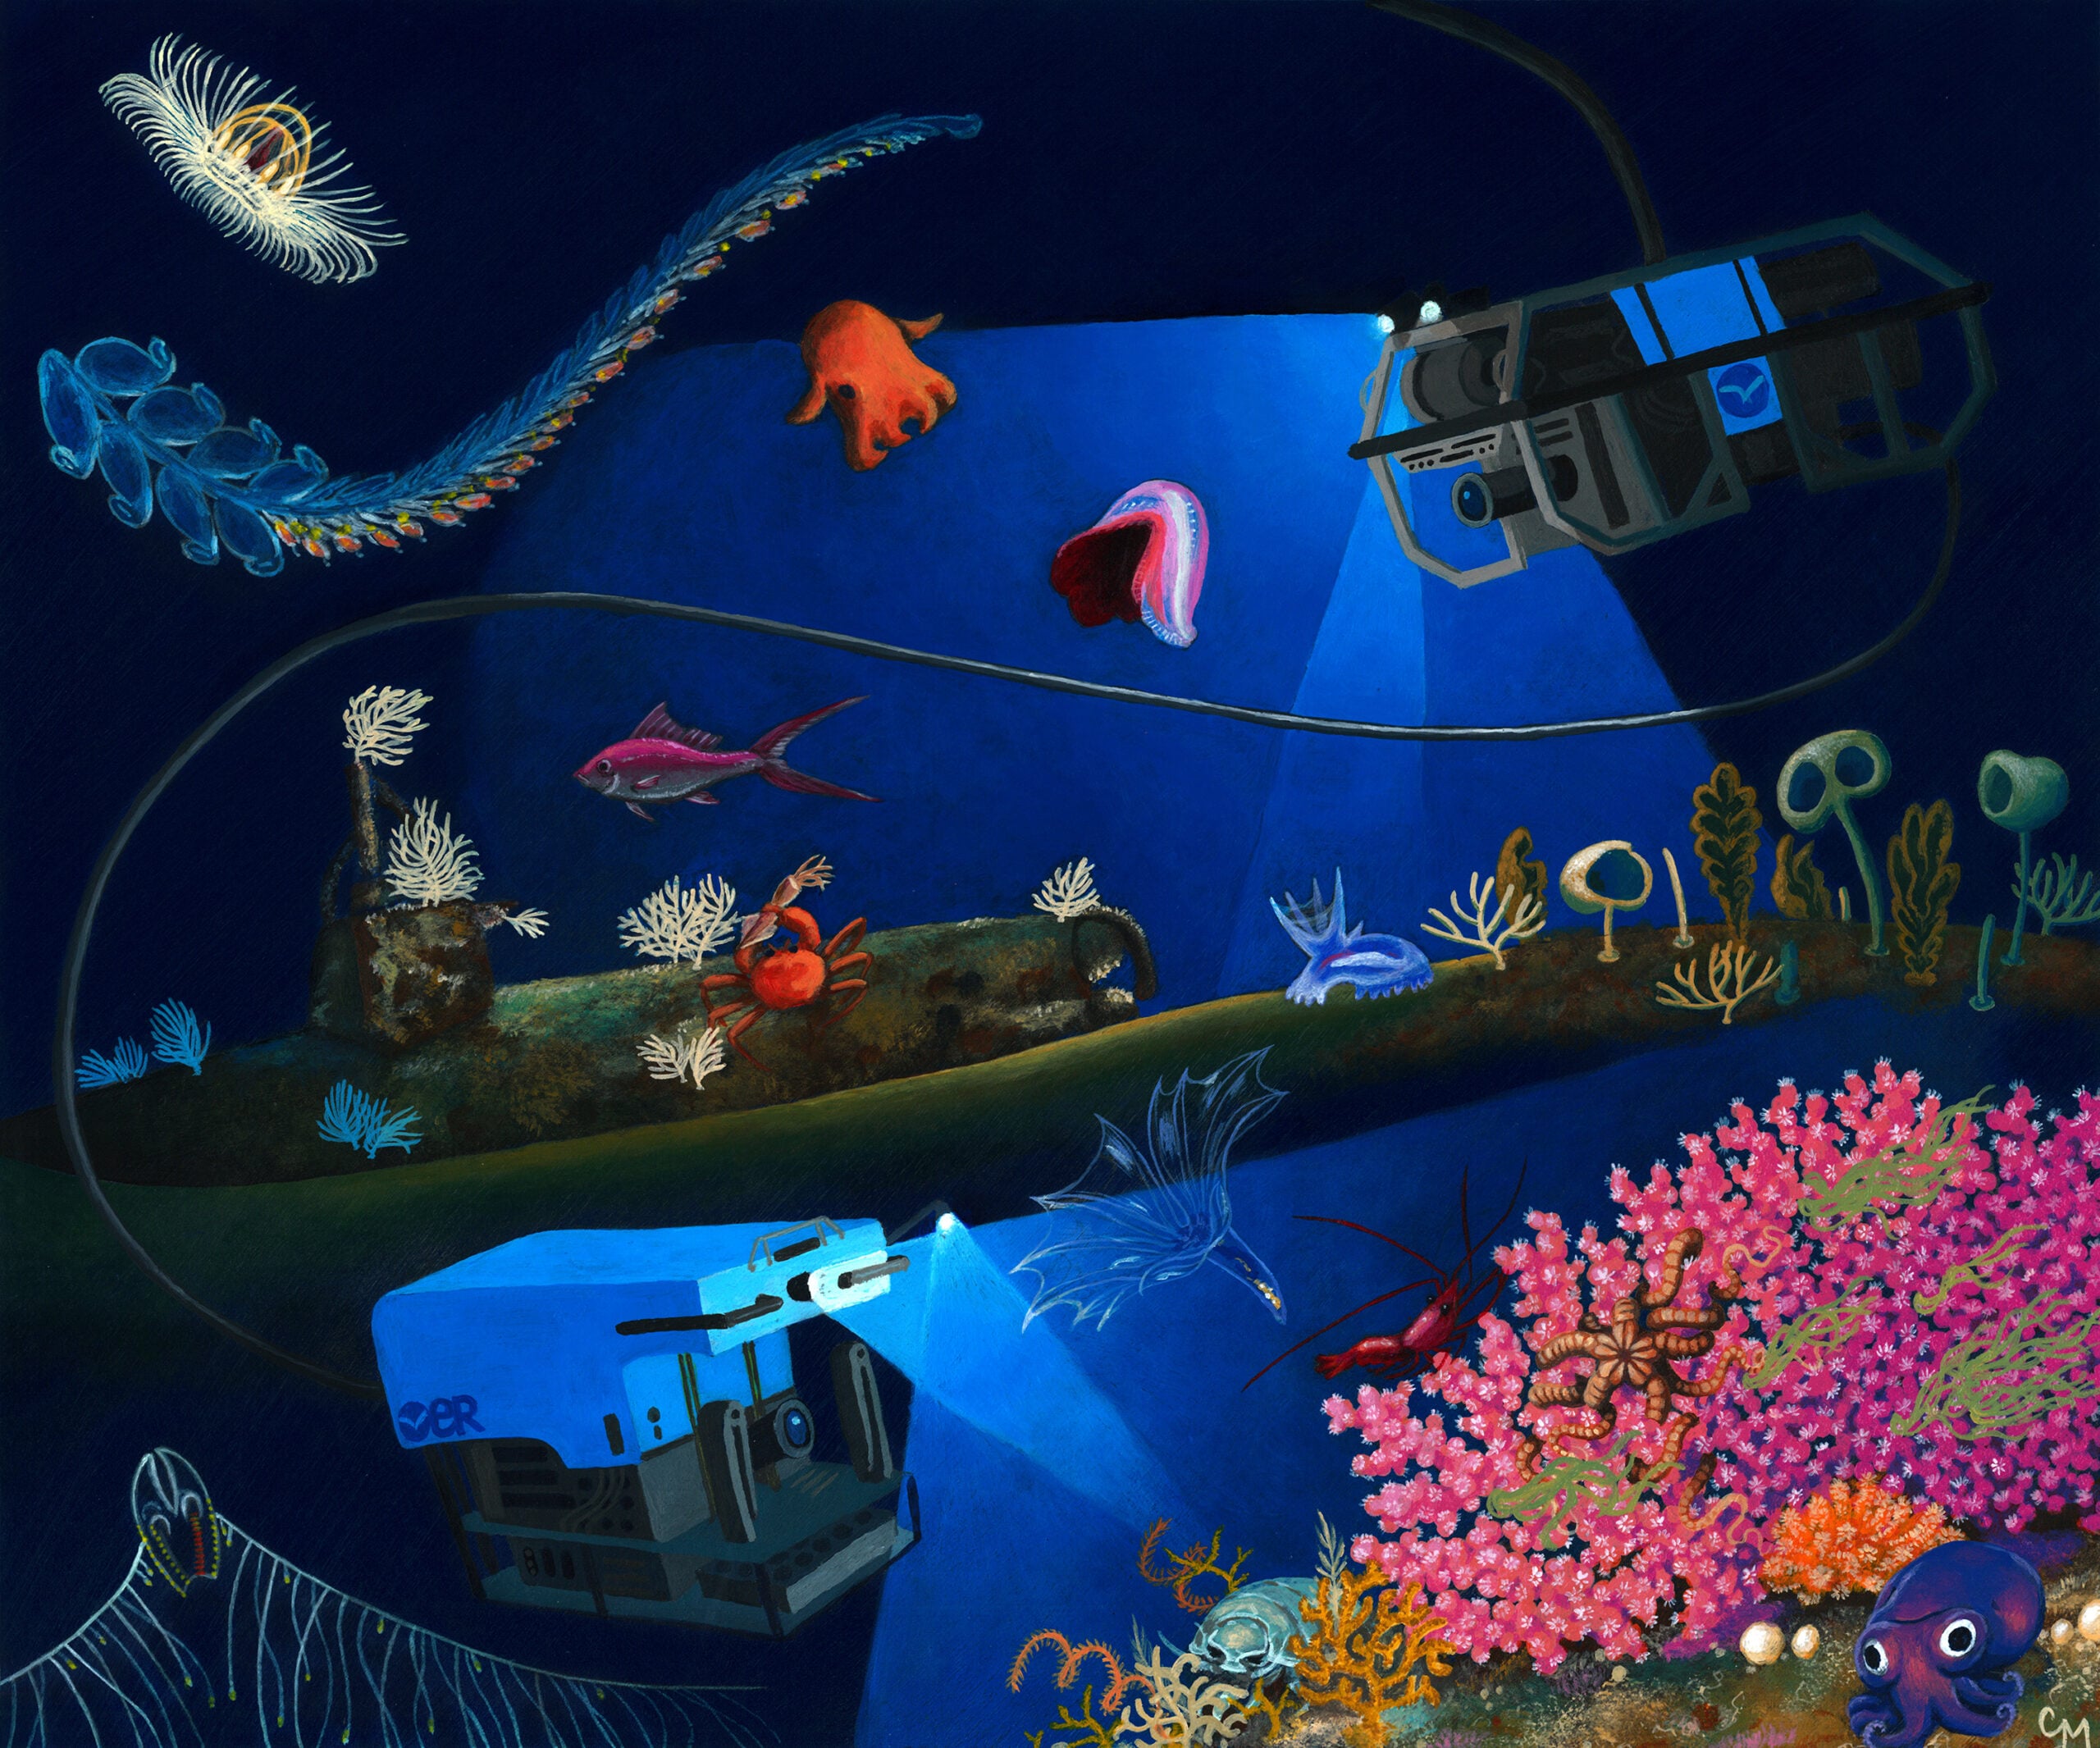
A thousand deep-sea vehicles would sound like an industrial-scale exploration fleet. At the average rate achieved by existing systems, however, even that fleet would need more than 100,000 years to carry cameras across the entire deep seafloor once.
The calculation appears in a 2025 Science Advances paper led by Katherine Croff Bell of Ocean Discovery League. The team compiled 43,681 records of visual dives deeper than 200 metres, spanning 1958 to 2024, then used two methods to estimate the area actually imaged.
The result was between 0.0006 and 0.001 percent of the deep seabed, or at most 3,823 square kilometres. That is less than one thousandth of one percent of a realm covering roughly two-thirds of Earth’s surface.
Three square kilometres per year is the crucial rate
The team built its annual-rate estimate from long operational records for one human-occupied vehicle, five remotely operated vehicles and three towed-camera systems. These included Alvin, Jason and Jason 2, Hercules, Little Hercules, Deep Discoverer, Argo, Argo 2 and Medea.
For each system, the researchers combined time on the seafloor with an assumed speed and a visual swath ten metres wide. Individual annual averages ranged from 0.59 square kilometres for Little Hercules to 6.05 for Alvin. Across the nine systems, the mean was 2.9 square kilometres per year.
The deep seafloor, defined in the study as seabed at least 200 metres below the surface, covers about 335.7 million square kilometres. A fleet of 1,000 systems working at 2.9 square kilometres each would record about 2,900 square kilometres per year. Dividing the first number by the second gives roughly 115,800 years. “More than 100,000” is therefore a rounded extrapolation, not a metaphor.
The 0.001 percent figure is an upper estimate
The researchers also calculated historical coverage from individual dive records. They estimated the areas observed by human-occupied vehicles, ROVs, camera tows and stationary landers, while accounting for overlapping tracks. That method produced a maximum of 2,130 square kilometres.
The time-based method assumed that an average of 20 systems operated each year from 1958 through 2023, deliberately higher than the 14.7 active systems represented annually in the database. It produced the larger 3,823-square-kilometre figure and the headline maximum of 0.001 percent.
The database is still incomplete. Commercial oil, gas and telecommunications imagery may be proprietary, while classified and embargoed dives were inaccessible. Some scientific records were missing or lacked navigational detail. The authors acknowledged that coverage could be undercounted. Their more durable point was that even an error of a full order of magnitude would leave visual records for less than one hundredth of one percent of the deep seabed.
Mapping the bottom is not the same as looking at it
The small visual fraction can sound inconsistent with reports that much more of the ocean floor has been mapped. The measurements refer to different kinds of knowledge. Multibeam sonar from ships can survey broad swaths and reveal depth, slope and major landforms. Cameras carried near the bottom show organisms, fine sediment, small geological features and interactions that a depth grid cannot resolve.
In April 2026, the GEBCO Seabed 2030 project reported that 28.7 percent of the global ocean floor had been mapped to its modern standards. That is substantial progress in bathymetry. It does not mean human observers have viewed 28.7 percent on video.
NOAA makes the same distinction in its updated answer to how much of the ocean has been explored: maps can locate terrain and potential habitat, but they cannot by themselves identify species or show how organisms interact with their surroundings.
The tiny sample is also concentrated in a few places
Coverage was not scattered evenly. Sixty-five percent of the observations in the compiled dataset took place within 200 nautical miles of the United States, Japan or New Zealand. Five countries, adding France and Germany, operated 97 percent of all recorded dives.
Nearly 30 percent of the observations were made before 1980, often producing low-resolution black-and-white still images rather than modern video. The problem is therefore larger than total area. Much of the available record is geographically concentrated, technologically uneven and shaped by where wealthy institutions have ships, vehicles and established research programs.
Space Daily’s earlier report on the dataset described the 43,681-dive tally and its Rhode Island-sized upper estimate. The rate calculation exposes the harder implication: brute-force expansion of the existing model cannot deliver exhaustive coverage on a human timescale.
A representative sample matters more than a complete sweep
The 100,000-year figure does not establish that every square kilometre must be filmed. A complete visual sweep would be enormously expensive, would begin ageing before it finished and would include vast repeated habitats. Scientific surveys routinely learn from carefully designed samples rather than observing every possible unit.
In 2026, Bell’s team followed the coverage estimate with Global Deep Sea Exploration Goals, a framework for building a more representative record. It divides the deep seabed using environmental and geographic factors, then identifies priority observations that would reduce the strongest biases.
The shift is from asking how much line a vehicle can cover to asking which missing lines would add the most information. It also makes participation part of the design. Countries with deep ocean in their exclusive economic zones should be able to shape the questions, operate tools and retain access to the resulting data rather than serving only as locations for expeditions led elsewhere.
Technology can change the numerator and the strategy
Traditional ROV and submersible operations require capable ships, specialist teams and long transit times. Smaller autonomous vehicles, low-cost imaging systems and longer-endurance platforms could put more cameras in more regions. Machine-assisted review can help researchers search volumes of imagery that already exceed what people can watch manually.
NOAA’s account of one Okeanos Explorer expedition gives the scale of the data problem: its ROV cameras generated more than one gigabyte of video per minute, and the ROV leg collected more than 17,300 gigabytes. Increasing collection without improving annotation, storage, discovery and open access simply moves the bottleneck ashore.
The study’s current rate is not a physical limit. It is a description of what nine established systems accomplished under the costs and operating patterns of their era. New vehicles can widen coverage, but a thousand improved vehicles would still need priorities.
The number is a warning against mistaking a sample for a world
“Less than 0.001 percent” is not a claim that the rest of the seafloor is wholly unknown. Satellites, sonar, sediment cores, acoustic instruments and biological sampling provide knowledge without optical images. Visual observation is one layer of evidence, valuable because it records colour, form, abundance, behaviour and context at the seabed.
The more careful conclusion is that humanity’s direct visual record covers a minute and unrepresentative fraction of the deep floor. The authors’ summary of the study notes that even a tenfold underestimate would not remove the gap.
A camera-by-camera attempt to see everything once would outlast civilizations. A strategically chosen global sample, collected with broader participation and shared openly, can improve much sooner. The 100,000-year calculation is useful because it closes off the fantasy that scale alone is a plan.