

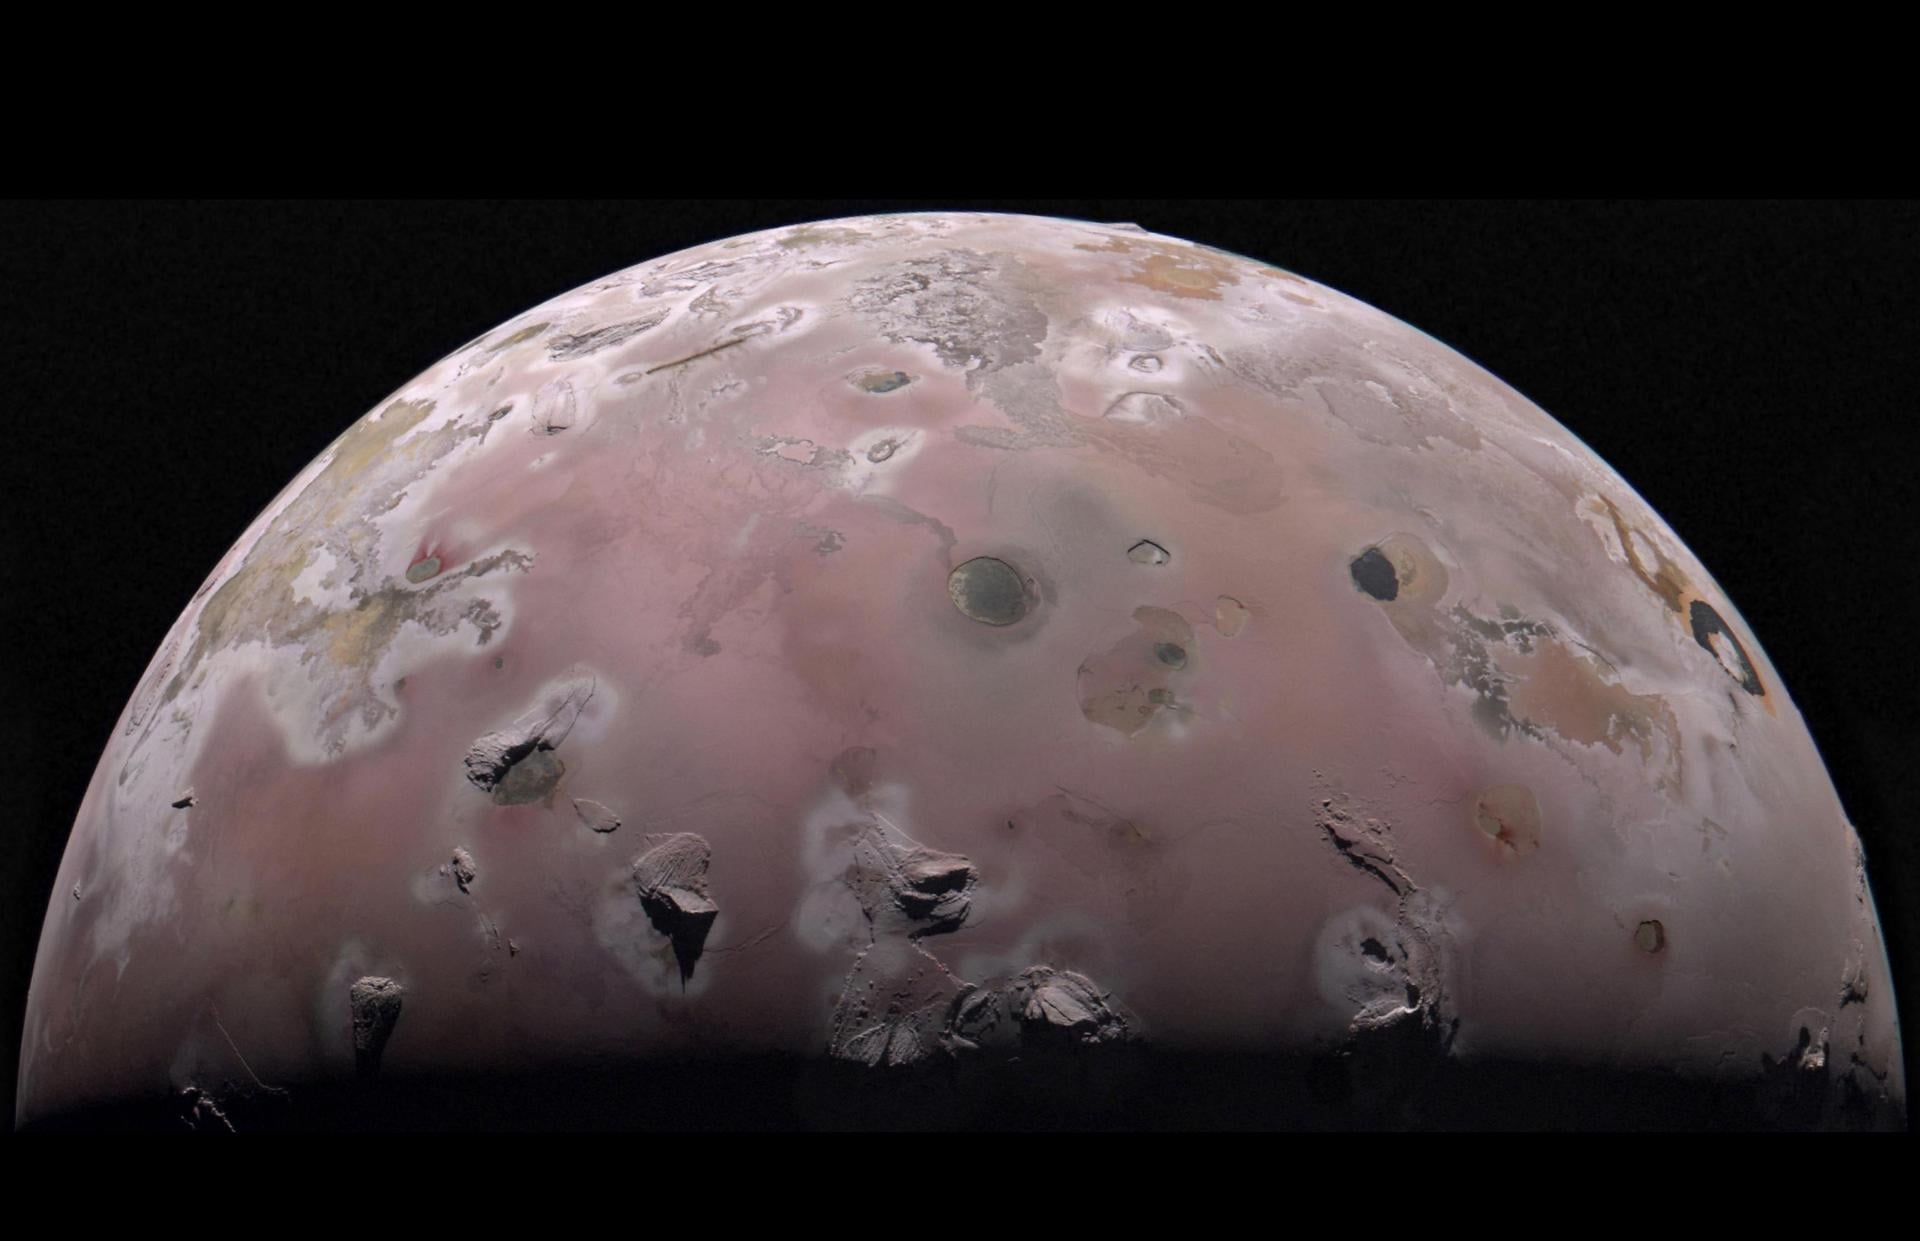
Io advertises its internal heat through lava lakes, changing flows and plumes that rise hundreds of kilometres above the surface. Those eruptions are so prominent that most measurements of the moon’s heat have naturally concentrated on the glowing places where energy escapes into space.
NASA’s Juno spacecraft has now detected a different signal. During close flybys on 30 December 2023 and 3 February 2024, its Microwave Radiometer measured thermal emission from below the visible surface. Across every region sampled, the inferred temperature rose by more than 20 degrees Celsius, or about 40 degrees Fahrenheit, within the upper few metres.
“Everywhere” needs a firm boundary. Juno did not survey every longitude and latitude of Io. The statement applies to the swaths covered during two flybys. Nor did the spacecraft insert a thermometer into the ground. It recorded microwave brightness at several wavelengths, then the team inferred temperature and depth through models of Io’s volcanic material.
The result comes mainly from one paper published in July 2026 in the Journal of Geophysical Research: Planets, led by Shannon Brown of NASA’s Jet Propulsion Laboratory. This is one study, not settled consensus. The observations require substantial heat below the sampled surface, but they do not yet choose between two sharply different ways of moving it there.
A radiometer built for Jupiter looked into rock
Juno’s Microwave Radiometer, or MWR, was designed to see through Jupiter’s opaque clouds. Six antennas observe radiation across frequencies from 0.6 to 22 gigahertz, corresponding to wavelengths from about 51 centimetres down to 1.3 centimetres. Longer wavelengths can generally emerge from deeper layers, although the effective depth also depends on the material’s electrical and physical properties.
That makes the instrument less like a camera and more like a six-layer thermal probe. Each channel records brightness temperature, a measure of microwave intensity expressed as the temperature a simple emitting surface would need to produce it. Recovering the actual temperature profile requires assumptions about reflection, absorption, density and how those properties vary below the surface.
Juno came within about 1,500 kilometres of Io on both encounters. NASA’s July 2026 account of the result says the combined channels sensed emission from a few centimetres down to several metres and, for the longest wavelengths, tens of feet. The achievement was unexpected because microwave sounding had previously been applied by Juno mainly to a gas giant and icy moons.
The measurement is a gradient, not a buried hotspot count
The paper reports an increase greater than 20 degrees Celsius within the upper few metres. This is not a claim that temperature rises by 20 degrees for every metre descended. It is the total shallow gradient needed to match the change in microwave brightness across the instrument’s frequency channels.
Solar heating alone cannot explain that direction and steepness. Sunlight warms the top surface during the day, whereas a profile that becomes substantially warmer below it points to energy moving up from inside the moon. The low-frequency channels showed the strong spectral slope at all sampled latitudes.
That last detail separates the result from a simple rediscovery of Io’s famous hotspots. Infrared instruments readily detect exposed lava and hot crater margins, but the microwave gradient appeared throughout Juno’s sampled terrain, including areas without the most conspicuous surface sources. It is fair to call the shallow heating widespread within the observations. It is too early to call it globally uniform.
The surface itself appears unusually light and smooth
The two flybys viewed some overlapping terrain from different angles. By modelling the way microwave radiation reflected from those areas, the team estimated a real dielectric constant between two and four. That is a measure of how strongly the material responds to an electric field and helps determine how deeply microwaves can penetrate.
For the upper layer, less than about ten centimetres deep, the inferred density was approximately 0.7 to 1.1 grams per cubic centimetre. Solid basalt is several times denser. The result instead resembles a porous mixture such as pumice or loosely packed volcanic ash, although the paper does not claim that Io’s regolith is literally identical to either Earth material.
At microwave scales, most of the sampled surface also behaved like broad smooth plains interrupted by the visible mountains. Smooth here refers to variations across footprints on the order of 100 kilometres, not to a polished landscape. JunoCam’s detailed image of Io’s north polar region shows rugged mountain blocks and extensive flow fields inside that larger-scale description.
The conductive model makes quiet crust part of the exhaust
The first explanation tested in the paper treats the near-surface material as a layer conducting heat steadily upward. Matching the microwave spectrum under that model requires a heat flow of roughly one to three watts per square metre.
A watt per square metre sounds small because it is spread out. NASA compares the local output with a small nightlight beneath every square yard. Integrated across Io, however, the modelled flux could be as much as about 30 times Earth’s average internal heat flow. Terrain that looks cold and inactive in infrared would still be releasing part of the moon’s enormous tidal heat budget.
This is not yet a direct global power measurement. The conversion from microwave slope to conductive heat flow depends on thermal conductivity, porosity, dielectric behaviour and temperature structure. Juno also covered only part of the moon. The value is what this deliberately simple crustal model requires, not proof that every square metre of Io emits within that range.
The alternative hides young lava or vents under a lid
A second model can reproduce the same broad spectral gradient without uniform conductive flow. In that interpretation, lava younger than about five years, or hot vents, lies beneath a cooling crust roughly nine to 11 metres thick. If these concealed sources cover about ten per cent of Io’s surface, their combined microwave emission can imitate a widespread background.
The figures are linked assumptions, not three separate discoveries. Juno did not directly map fresh lava under precisely ten per cent of the moon, and it did not identify a buried vent beneath every radiometer footprint. The model shows that a patchwork of numerous young or thinly covered sources remains physically capable of producing the observed spectrum.
Surface observations make that possibility plausible without confirming its scale. Juno’s infrared mapper has found hot rings around many of Io’s paterae, interpreted as exposed lava at the margins of largely crusted-over lakes. Infrared radiation comes from the top skin. Microwave radiation can preserve information about heat hidden farther down, so the two instruments see different parts of the same cooling system.
Tidal flexing supplies the heat, but not a simple map
Io’s energy ultimately comes from its orbit. Jupiter’s gravity pulls more strongly on the near side of the moon than the far side, stretching the body. Europa and Ganymede maintain a slight eccentricity in Io’s orbit through a 4:2:1 resonance, so the stress changes during every 42.5-hour circuit instead of settling into one permanent bulge.
Rock responds with a delay. Part of the mechanical energy is dissipated as heat, melting material and sustaining the most volcanically active body known. SpaceDaily’s earlier explanation of Io’s tide in solid rock describes modelled vertical motion that may reach roughly 100 metres across an orbit.
Great heat output does not require a shallow, global ocean of magma. A 2024 Nature study using Juno and Galileo measurements found that Io’s tidal response was inconsistent with such a layer. The result favoured a mostly solid mantle with partial melt and separate magma reservoirs, while leaving more deeply buried configurations less tightly constrained.
The new microwave result fits that broad picture but does not locate where the tidal energy was first dissipated. Heat generated deeper down can conduct towards the surface. Magma can carry it upward and stall in local chambers. Eruptions can then spread lava that remains warm beneath a thickening lid. Several routes may operate at once.
Hotspots and background heat answer different questions
A map of bright infrared hotspots asks where the surface is hottest now. A microwave temperature profile asks how warmth changes below the surface across a much larger footprint. Treating one as a higher-resolution version of the other would miss the paper’s main contribution.
The MWR data also contained localised areas about 10 to 20 degrees Celsius warmer than surrounding terrain. Those variations sit on top of the wider spectral gradient. Joint analysis with surface ages, mapped flows and Juno’s infrared observations may reveal whether they correspond to buried activity, different material properties or both.
More spatial coverage is the clearest way to distinguish the two broad models. A conductive background should relate systematically to crustal thickness and thermal properties. Concealed young flows should correlate more strongly with recent surface change, volcanic centres or cooling patterns. Either comparison is difficult when the existing footprints come from only two encounters.
A planetary instrument found an unplanned second profession
NASA’s Juno mission entered Jupiter orbit in 2016 to investigate the planet’s origin, interior, atmosphere and magnetic environment. Its extended mission turned repeated encounters with the Galilean moons into experiments the spacecraft was not originally designed to perform.
MWR had already probed the icy shells of Ganymede and Europa. Io showed that the technique can also recover information from porous volcanic rock. The paper’s authors suggest that a related instrument near an Earth volcano might detect subsurface temperature gradients unavailable to an infrared camera.
That is a proposal, not a direct transfer. Earth’s atmosphere contains water vapour that interacts strongly with microwaves, and terrestrial instruments face different distances, geometries and safety requirements. The useful point is narrower: wavelength-dependent microwave emission can reveal heat beneath a rocky surface without landing or drilling.
The first look below Io remains a modelled one
Juno has not photographed lava channels under Io’s crust. It measured a spatially resolved microwave spectrum, removed reflected sky radiation, estimated the surface’s reflective properties and compared the result with two thermal models. “First look beneath” describes a new kind of remote measurement, not a literal underground image.
The strongest conclusion survives those qualifications. Every sampled region showed a near-surface temperature increase too steep for sunlight alone, even away from the volcanic points that dominate conventional heat maps. Either Io conducts a broad internal flux through its porous crust, or far more of its apparently quiet terrain conceals young lava and covered vents than an infrared view reveals.
Further observations must decide how much each mechanism contributes. For now, the upper few metres have changed the picture of Io from a cold surface punctured by isolated furnaces to a moon whose quiet ground may also be carrying heat towards space.