Not many charts get famous. Stock tickers don’t count, and neither does the pie chart from a meeting nobody remembers a week later.
But there’s one jagged, climbing line that keeps turning up everywhere: in An Inconvenient Truth, on classroom posters, cited in nearly every article about the atmosphere ever written, mine included. Ask a scientist to name the single most important line ever drawn on a graph, and a fair number will point to this one.
It’s called the Keeling Curve, and the reputation attached to it usually comes with a specific claim built in: that one lonely research station has taken the same reading, every single day, without missing one, since March 1958. Charles F. Kennel, who directed the Scripps Institution of Oceanography, called Charles David Keeling’s measurements “the single most important environmental data set taken in the 20th century” in the days after Keeling died in 2005. Sixty-eight years of near-daily readings will earn a line like that. The specific part of that reputation about zero interruption, though, isn’t actually true.
The claim: a line that never once broke
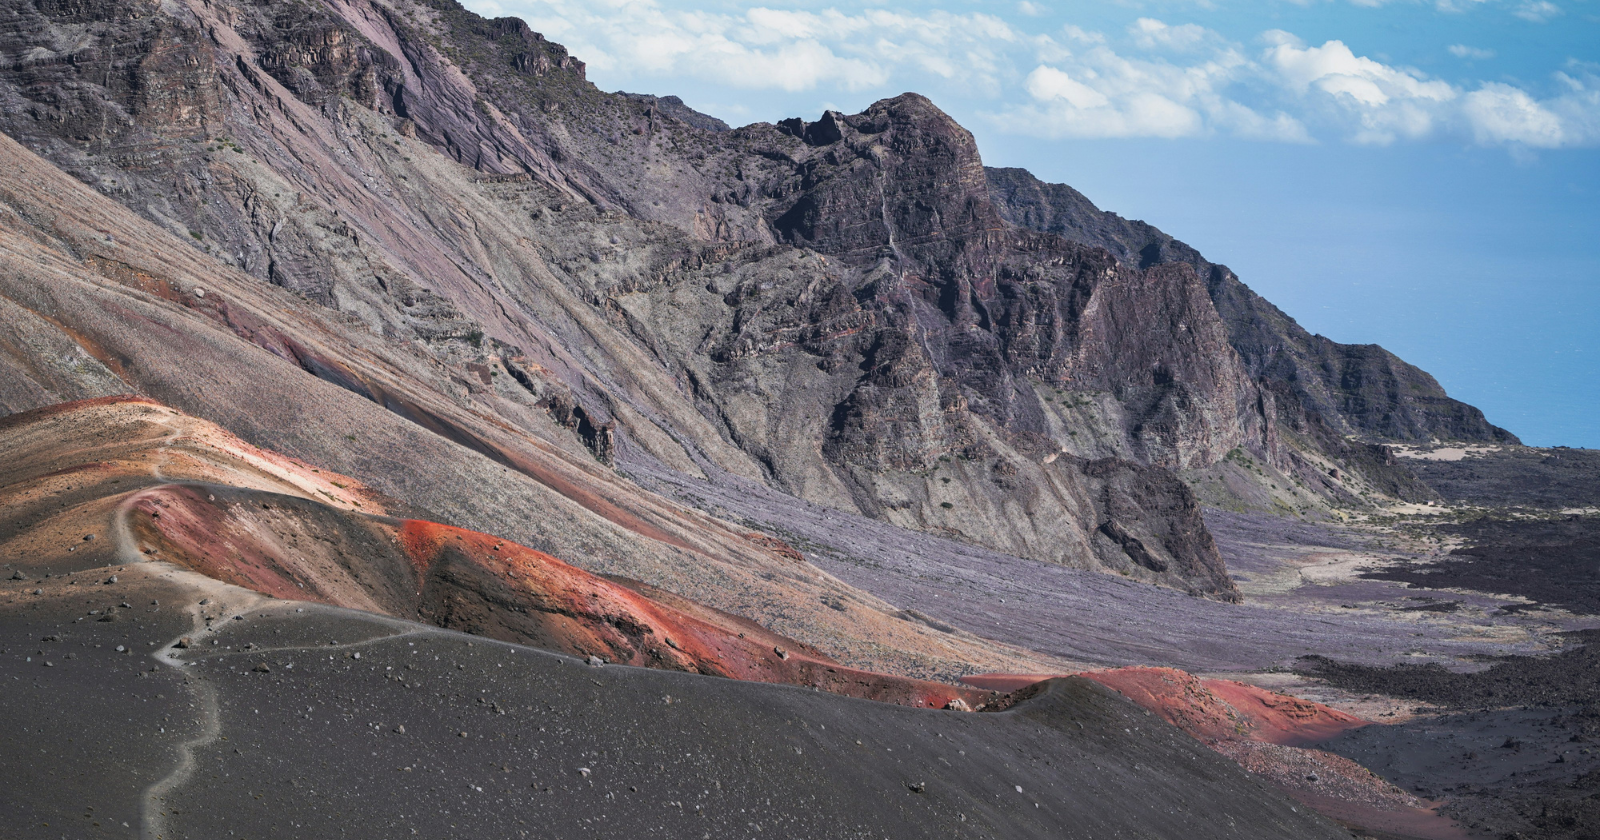
The instrument sits at the Mauna Loa Observatory, more than two miles up the slope of an active Hawaiian volcano, sampling air pumped in through an intake on a tower. On its first day of operation in March 1958, it recorded 313 parts per million of carbon dioxide. By the end of that same year, the level averaged out closer to 315 parts per million, roughly where the title above starts its count. What makes the record so quotable is the idea that it just kept going after that, unbothered, for nearly seven decades straight. That’s the version most people repeat, and it’s the version I’d have repeated too before I looked into it.
What actually happened in 1964, 1984, and 2022
Scripps’s own account of the record is more honest than its popular reputation. The institution’s history notes “sustained periods without measurements in 1964 when budget cuts within the federal agencies supporting the record suspended operations for several months,” and a second gap “in 1984 when another Mauna Loa eruption cut off power,” with no readings from March 26 to April 29 that year. A third gap arrived on November 28, 2022, when Mauna Loa erupted again and knocked out power to the observatory. Scripps geoscientist Ralph Keeling, who now runs the CO2 program his father founded, called it “a big eruption” and “in a bad place,” and described the outlook for readings from the station as “very troubling.” A backup analyzer went up the road at Mauna Kea a little over two weeks later, and full monitoring only resumed at Mauna Loa itself roughly a year after that.
So the line has broken at least three separate times: once for months, over money; once for five weeks, over lava; once for weeks, over lava again. Whatever makes this record worth trusting, it isn’t the myth that nothing ever interrupted it.
Why the record is still trustworthy anyway
Most people who question the record have never even heard about the gaps. Their real objection is usually about the site itself: how can one station, perched on one volcano in the middle of one ocean, stand in for the entire planet’s atmosphere? Mauna Loa works for a plain physical reason: air at that altitude, far above local traffic, farmland, or cities, is well mixed long before it reaches the intake.
Researchers also actively screen the hourly data for the volcano’s own exhaust, discarding readings that spike or behave erratically, and what’s left tracks independent measurements from a separate Scripps sampling program to within a few hundredths of a part per million on average. Other stations scattered across the globe, from the South Pole to the Arctic, show the same climbing trend. One mountainside gets checked constantly, against itself and against every other station taking the same measurement elsewhere on the planet.
That, to me, is the more interesting fact than the myth of an unbroken line. Nobody at Scripps or NOAA has ever pretended the record is flawless. They’ve published the gaps, dated them, and explained exactly how each one was patched or bridged. A dataset that owns its interruptions in public is worth more than one that claims it never had any.
What the number says today
As of the most recent full month on record, August 2026, the monthly average at Mauna Loa was 427.55 parts per million, up from about 425.5 a year earlier. That’s the “more than 420” this article’s title promised, and then some. I’m not a climate scientist, and I’m not going to pretend this number tells you what to think about energy policy or anyone’s individual choices. What it tells me, reading it as a private citizen who likes a good long-running dataset, is simpler: the line keeps climbing, the interruptions notwithstanding, because someone kept showing up to measure it again after each one.
The Keeling Curve isn’t the only long climbing line written across the atmosphere. A separate global record, built partly from ordinary people counting stars by eye year after year, shows the night sky itself has been getting brighter by roughly 10% annually — fast enough to fade the Milky Way within a single childhood. If this topic interests you, check out this video by Space Daily: A Third of Humanity Can No Longer See the Milky Way.
The habit that matters more than the streak
I’m a big believer in routines, mostly because I don’t have the luxury not to be. Between my husband and me both working full time and two daughters under two in the house, the only way anything resembling a calm evening happens is if the same small things get protected on purpose: dinner around the same time, the same short bedtime sequence, the kitchen reasonably tidy before anyone goes to sleep. Some nights that routine gets wrecked completely. A sick kid, a late flight, a work deadline that eats the evening. What actually holds the season together is simpler: we pick the routine back up again the next night and treat one broken evening as exactly that, one evening, rather than proof the whole system failed.
That’s the part of the Keeling Curve I find genuinely reassuring, once you know the real history instead of the tidier version. Every time the machine on the volcano went down, in 1964 and 1984 and 2022, someone got it running again and kept the same small, unglamorous measurement going. Sixty-eight years of a habit resumed, again and again, means more to me than sixty-eight years of a habit that supposedly never needed resuming in the first place.