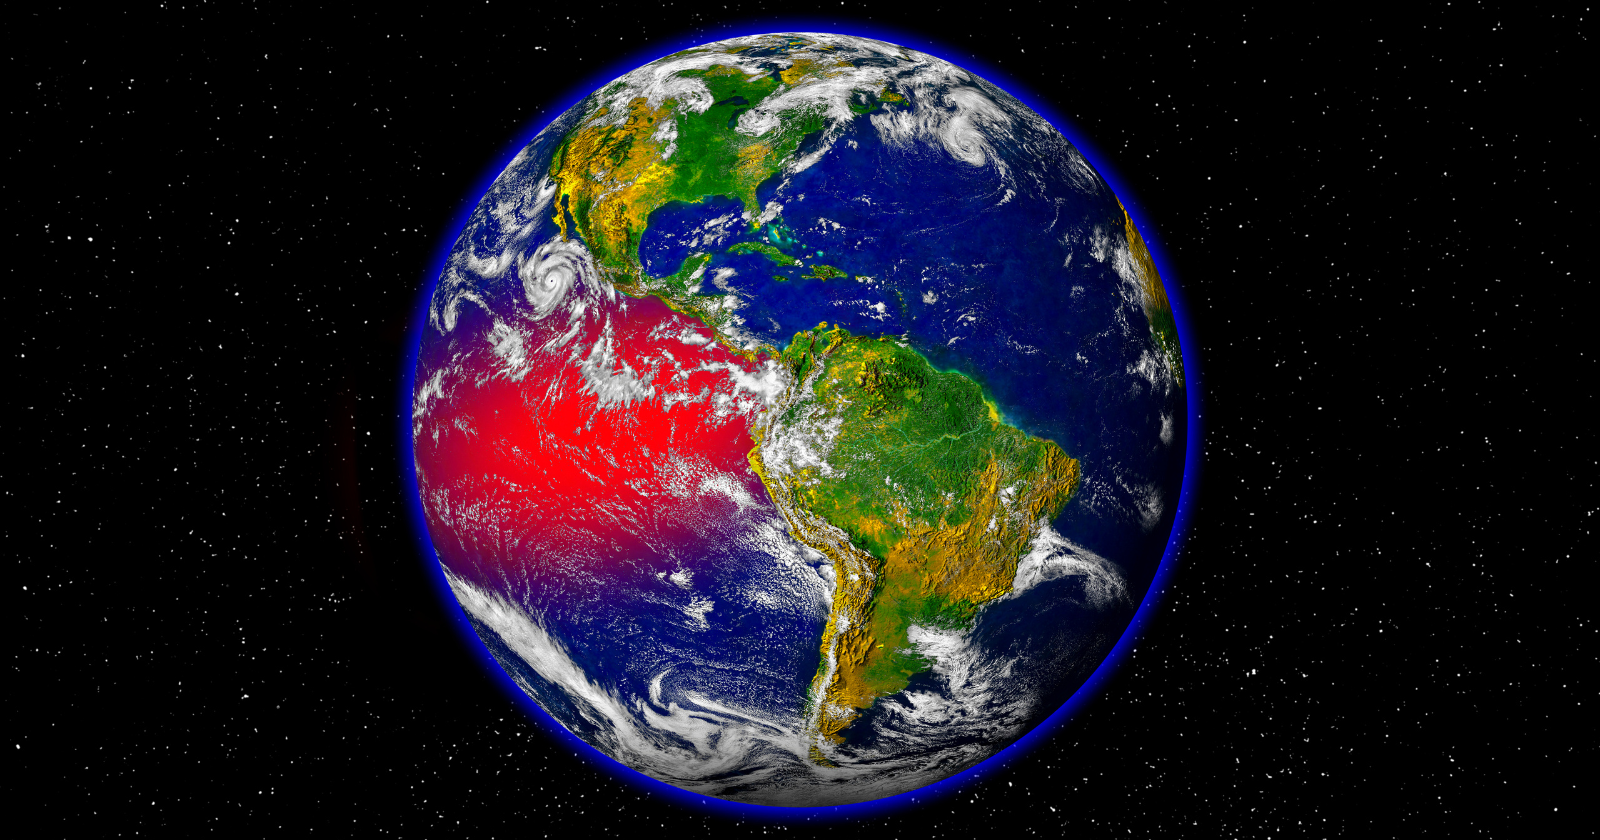
NOAA’s Climate Prediction Center issued an El Niño Watch on 12 March 2026, the formal alert level indicating favourable conditions for the development of the climate state called El Niño within the following four months. The agency’s most recent diagnostic discussion places an 82 per cent probability that El Niño will emerge in the central equatorial Pacific between May and July 2026 and a 96 per cent probability that it will persist through the 2026-27 Northern Hemisphere winter. There is, on the agency’s current modelling, a two-in-three chance that the developing event will reach strong or very strong intensity.
The implications of those figures are not obvious from the numbers themselves. El Niño is a periodic warming of the surface waters of the central and eastern equatorial Pacific Ocean, ranging from one to three degrees Celsius above the local seasonal average, confined to roughly one per cent of the planet’s surface. The change is small in absolute terms. The cascade of consequences is not.
What determines whether the current event reaches the threshold the new index defines for a strong El Niño will be decided in the next few weeks, by something happening above the Pacific that scientists can measure but cannot yet predict. The short video below walks through what that is, what is happening right now in the ocean below, and what the answer will mean for the global temperature record over the following twelve months.
The 1997-98 El Niño event, the strongest of the twentieth century by some measures, was responsible, according to figures published by the United Nations and summarised in NASA’s ENSO documentation, for more than 20,000 deaths worldwide and approximately US$36 billion in infrastructure damage. The 2015-16 event, of comparable magnitude, produced what was then the warmest year on the global temperature record and, per the peer-reviewed analysis published by Jiménez-Muñoz and colleagues in Scientific Reports, the most extensive drought yet measured in the Amazon rainforest. The cycle has been observed in coral and sediment records going back at least 5,000 years.
Every one of the ten warmest years on the global surface temperature record, which begins in 1850, has occurred in the past decade.
The El Niño event NOAA is now forecasting will develop in a Pacific Ocean whose underlying temperature has warmed enough that, in February 2026, the Climate Prediction Center quietly replaced the standard index used to measure the cycle for the previous thirty years. The new index, the Relative Oceanic Niño Index, accounts for the long-term ocean warming that the old measurement no longer cleanly distinguished from the natural cycle.
How the cycle works
The mechanism that produces El Niño was not understood as a coupled ocean-atmosphere phenomenon until the Norwegian-American meteorologist Jacob Bjerknes published his explanation in the Monthly Weather Review in 1969. Before Bjerknes, the warming of the eastern equatorial Pacific that Peruvian fishermen had called El Niño for centuries was understood as an oceanographic anomaly. The atmospheric circulation pattern that produced the warming, and which the warming in turn reinforced, had not been connected to it.
Under normal conditions, the trade winds along the equator blow from east to west, pushing warm surface water westward across the Pacific. The warm water piles up in the western Pacific, forming what oceanographers call the Indo-Pacific warm pool, an area where surface temperatures routinely exceed 28 degrees Celsius. Cold, deep water rises in the east to replace the surface water the trade winds have moved away. The eastern Pacific stays cool. The temperature difference across the basin drives a circulation pattern of rising air in the west and sinking air in the east, called the Walker circulation, which in turn reinforces the trade winds.
The feedback loop Bjerknes identified in his 1969 paper is what makes the cycle self-sustaining. When the trade winds weaken, for reasons that may be internal to the ocean-atmosphere system or external to it, the warm pool spreads eastward. The warmer water in the central and eastern Pacific weakens the temperature difference across the basin. The Walker circulation slackens. The trade winds weaken further. The warming spreads further east. The cycle becomes self-sustaining for somewhere between nine and eighteen months before unwinding back to the neutral state or, occasionally, to the opposite phase.
The opposite phase, in which the trade winds strengthen and the eastern Pacific cools, is called La Niña. Together the two phases constitute the El Niño-Southern Oscillation, or ENSO, which is the largest single source of year-to-year climate variability on the planet.
How it became measurable
The 1982-83 El Niño, the strongest event of the twentieth century until that point, developed in the equatorial Pacific without being detected by any of the monitoring systems then in operation. The event killed approximately 2,000 people, caused approximately US$13 billion in damage, and produced widespread agricultural and ecological disruption across the Pacific Rim. The scientific community’s failure to predict it became the proximate motivation for the construction of the global ocean monitoring system that exists today.
The TOGA programme, short for Tropical Ocean Global Atmosphere, ran from 1985 to 1994 as an international research effort to build an observational framework capable of detecting an ENSO event in real time. Its principal output was the TAO/TRITON moored buoy array, operated by NOAA’s Pacific Marine Environmental Laboratory and partner agencies, a network of approximately seventy instrumented buoys distributed across the equatorial Pacific that measures sea surface temperature, subsurface temperature, wind, humidity, and ocean currents at standardised intervals. The array became fully operational in 1994. It has produced continuous measurements of the equatorial Pacific for more than thirty years.
The buoy array is supplemented by satellite measurements of sea surface temperature, satellite altimetry measurements of sea surface height, and the global Argo float network of approximately 4,000 autonomous instruments that measure the ocean’s interior. The combined monitoring system observes the equatorial Pacific in detail sufficient to detect the early stages of an ENSO event roughly six to twelve months before the surface temperature signal would have been recognised by the methods available in 1982.
The 1997-98 El Niño was the first event the new monitoring system observed from inception. The 2015-16 event was the first observed in the era of high-resolution satellite altimetry. The 2023-24 event was forecast by NOAA with high confidence more than six months in advance of its development.
What the new index is for
The standard measurement used to define an El Niño event for the previous thirty years was the Oceanic Niño Index, the running three-month average of sea surface temperature anomalies in the Niño 3.4 region of the central equatorial Pacific. An anomaly of 0.5 degrees Celsius above the long-term baseline, sustained for five overlapping three-month periods, was the formal threshold for El Niño classification. The threshold for La Niña was the corresponding cool anomaly.
The problem with this measurement, as climate change has progressed, is that the baseline against which anomalies are calculated has itself been warming. The long-term average sea surface temperature in the Niño 3.4 region has risen by approximately 0.6 degrees Celsius since 1950. The old index, working from a 1991-2020 reference period, increasingly classified as El Niño some ocean states that, on the cycle’s traditional understanding, were not produced by the trade-wind weakening that defines the phenomenon. The measurement was no longer cleanly distinguishing ordinary background warming from genuine ENSO variability.
In February 2026, NOAA’s Climate Prediction Center adopted the Relative Oceanic Niño Index, which calculates sea surface temperature anomalies in the Niño 3.4 region relative to the tropical Pacific mean. The relative index removes the secular warming trend from the measurement and isolates the variability associated with the natural cycle.
The practical consequence is that the new index, in most cases, will give weaker readings for El Niño events and stronger readings for La Niña events than the old index gave for the same ocean conditions. The historical record has been recalibrated. The list of events the new index recognises as strong El Niño years is shorter than the corresponding list under the old index.
The forecast NOAA has now issued for May-July 2026, an 82 per cent probability of El Niño emergence as measured by the new index, will be the first major forecast verified against the new measurement.
The El Niño cycle is, on the available evidence from coral and sediment records, a feature of the planet’s climate system that has operated at irregular intervals of two to seven years for at least the past five thousand years. The current event will be the next iteration of that cycle.
It will be the first iteration to develop in a Pacific Ocean whose underlying temperature has warmed sufficiently that the standard index of the past thirty years no longer cleanly describes what the ocean is doing. It will be the first iteration to be monitored by a measurement system explicitly designed to separate the natural cycle from the background warming. And it will be the first iteration to develop in a decade in which every one of the ten warmest years in the 175-year temperature record has already occurred, including 2024, which was warmer than the peak year of the 2015-16 event by approximately 0.25 degrees Celsius despite the absence of a strong El Niño signal contributing to it.
What scientists are watching for, in the months between now and the formal declaration that an El Niño has begun, is whether the developing event will reach the threshold the new index defines for a strong event, and what the global temperature record for 2026 and 2027 will look like as the warming signal of the cycle is added to a baseline that has already exceeded every previous record.
The answer to both questions, on NOAA’s current forecast, will be known by the early months of 2027.